

Chapter 4: THE ENHANCEMENT OF FUNDAMENTAL PHOTOSYNTHETIC PROPERTIES, GROWTH AND YIELD IN MR219 AND MR263 RICE VARIETIES VIA EARLY-STAGE CO2 ENRICHMENT TO THE SEEDLINGS BEFORE TRANSPLANTING (THESIS)
- PlantHouse Enterprise
- Apr 2
- 34 min read

1.1 Introduction
World food consumption in the next 30 years is expected to rise by at least 60% over 2006 levels due to expanding population, according to FAO (2016). As a result, rice output will need to improve to significantly fulfil this 60% increase in need. The rapid increase in atmospheric carbon dioxide (CO2) concentration has been a critical worldwide climate concern. The current historical record of atmospheric CO2 reached a climax of 415 ppm in January 2021 (ESRL, 2021), and this upward trend will undoubtedly continue. By the end of the century, it is expected to reach 936 ppm (IPCC, 2013). CO2 fuels photosynthesis activity; therefore, its rise improves photosynthesis rates that enhance crop output (Sakai et al., 2019). Moreover, according to Xu et al. (2016), plants grown in enriched CO2 environments have a relatively lowered transpiration rate, efficient water use, reduced respiration, whittled-down stomatal conductance and density than plants at ambient CO2. The significant intraspecific difference in crop yield response to increasing CO2 was discovered in main food crops such as rice (Kobayashi et al., 2006; Lv et al., 2020; Sakai et al., 2019; Usui et al., 2016), wheat (Broberg et al., 2019; Hogy et al., 2009; Pandey et al., 2017) and soybean (Li et al., 2017; Nakamoto et al., 2015; Sakurai et al., 2014).
The CO2 enrichment technique is prevalent in producing commercial and high-value horticultural crops. However, it is technically not feasible to elevate CO2 throughout the whole rice crop life cycle due to the massive areas involved in major food crops such as rice. For rice, it is normal for the seedlings to be raised in a nursery for 15-20 days before transplanting to the field. Therefore, this study attempted to apply CO2 enrichment only at the stage of preparation of this nursery to find out its effects until the final stage of rice harvesting. However, there is a shortage of considerable evidence regarding the possible effects of eCO2 on local rice varieties, which is critical for a comprehensive understanding of plant responses to elevated CO2.
The present experiment was designed to test the hypothesis that eCO2 rice seedlings might improve photosynthetic performance and eventual yield components in both rice varieties. Hence, the objectives of this chapter is to assess the efficacy of growing rice in eCO2 during the seedling stage in improving photosynthetic performanceand rice harvest components in both MR219 and MR263 rice varieties.
1.2 Materials and methods
1.2.1 Experimental location and environment condition
The eCO2 and aCO2 seedlings from the chamber as mentioned in Chapter 3 were transplanted after 25 days after sowing (DAS) at the rainout shelter structure at Field 15 research farm, University Putra Malaysia, Serdang until harvest (from January 2020 to April 2020). The space used is 4 meters x 6 meters and the upper structure is covered with one layer of plastic 0.15 mm (150 µm) thickness with UV filtering quality of up to 7%. The structure is surrounded by white greenhouse netting with 24 mesh sizes and 65 g/m2 (GSM) standard. This is to account for the impacts of rainfall and insect infestation, the experiment was conducted beneath a rain shelter. The experimental location is situated at the latitude of 2 ͦ 59′ 0.42″ N and a longitude of 101 ͦ 44′ 104″ E.
The rice seedlings were transplanted into a 3.79-litre container (Figure 4.1). The dimension of the container is 16 cm in height and 20 cm in diameter filled with soil taken from a paddy field in Tanjong Karang, Selangor. The soil properties were mentioned in Table 4.1 below. The containers were equipped with drip irrigation to supply water into the container with a timer system which has been set for every 4 hours every day to ensure the availability of water inside the container until ten days before harvesting. Throughout the experiment, the average temperature within the shelter was 25 to 38o C, with a humidity level of 60 to 80%. The CO2 level inside the shelter is about 404±30 ppm from data measured using a CO2 data logger (Century Harvest, Model TH2000). The plants generally received 12 hours of daylight inside the structure (Figure4.2). The light spectrum and intensity within the rainout shelter structure were measured using a spectrometer (LI-180 Licor, Lincoln, Nebraska, USA). Figure 4.2 and Table 4.2 show the light spectrum and intensity data measurement recorded at noon.

Figure 4.1 : Transplanted eCO2 and eCO2 MR219 and MR263 rice seedlings
Table 4.1 : Soil properties used in the study
Soil physical properties | Value |
Clay, % Silt, % Fine, % Coarse Sand, % Textural class | 39.0 42.1 16.7 2.2 Silty clay loam |
Soil chemical properties |
|
pH Total Nitrogen, % Total Phosphorus, mg/kg Organic Carbon, % Available Phosphorus, mg/kg Potassium (K), 1cmol/kg- Magnesium (Mg), 1cmol/kg- Calcium (Ca), 1cmol/kg Sodium (Na), cmol/kg- Boron (B), 1mg/kg- Copper (Cu), 1mg/kg Zinc (Zn), 1mg/kg- Iron (Fe), -mg/kg- Manganese (Mn), 1mg/kg- CEC, cmol/kg Conductivity, dS/m | 5.2 0.29 362 2.38 13 1.6 0.75 1.65 1.7 0.56 0.77 0.43 40 22 16.8 0.160 |

Figure 4.2 : The light spectrum inside the rain shelter at noon
Table 4.2 : The light intensity inside the rain shelter at noon
Photon Flux Density | Intensity (μmol m-2 s-1) |
PPFD PFD-Blue PFD-Green PFD-Red PFD-Far Red PFD-UV | 1106 271.8 396.8 437.2 331.9 20.7 |
1.2.2 Experimental design and treatments
A randomised complete block design (RCBD) with four blocks was used to test the treatments, which included two CO2 concentration levels and two rice varieties. Each block consists of 3 replicates of growing containers for each treatment. Each growing containers were planted with two rice seedlings that are grown for the chambers described in Chapter 3 of this thesis.
1.2.3 Plant maintenance
Fertilization and was applied during the rice early tillering, panicle initiation and heading phases according to Saad et al.(2014). The fertilizer program schedule is mentioned in Table 4.3 below. Rice plant diseases, insect pests, and weeds were all monitored regularly during the trial. Wood vinegar and neem oil-based solution was applied every two weeks to control insect pest infestations. For this application, wood vinegar and neem oil-based solutions are diluted according to the dilution ratio recommended on the product label. Generally, wood vinegar is diluted at a ratio of 1:100 to 1:200, while neem oil is diluted at a ratio of 1:10 to 1:20. This solution is sprayed on the entire section and each tree homogenously using a spray bottle or pressure sprayer to give a universal effect. The wood vinegar can repel insects and neem oil has insecticidal and antifeedant properties that can help control insect pests Solar-powered ultrasonic animal repellent (OEM, China) was used to control the plants from birds and rodents. In addition to precautions, rodent traps were also installed in the structure for rodent control. For weeds control, hand weeding was applied weekly throughout the experiments to ensure that all unwanted weeds were removed. Figure 4.3 show the rice panicle exertion stage (70 DAS).
Table 4.3 : Fertilizer program schedule for each container
Day After Sowing | Fertilizer | Quantity |
35 DAS | NPK 15:15:15 Urea TSP | 3 g 2 g 2 g |
55 DAS | NPK 12:12:17:2+TE Urea | 3 g 2 g |
70 DAS | NPK 12:12:17:2+TE MOP | 3 g 1 g |

Figure 4.3 : Rice panicle exertion stage (70 DAS) inside the shelter structure
1.2.4 Biochemical and physiological analysis
1.2.4.1 Gas exchange measurement and chlorophyll fluorescence
According to Yoshida (1981), CO2 absorption during the grain filling stage accounts for 60–100% of the carbon content of rice grains. Flag leaves are mentioned as the most important contributors to the build-up of dry matter in rice grains (Black et al., 1995). The flag leaf is the last leaf to emerge and is the largest and most physiologically active leaf in the rice plant. It is located at the top of the plant and is well-exposed to sunlight, making it a suitable candidate for gas exchange measurements. As the rice plant matures, the photosynthetic activity of the upper leaves declines, while the flag leaf remains highly active and contributes the majority of the photosynthate required for grain development. Therefore, measuring gas exchange in the flag leaf provides a good estimate of the overall photosynthetic activity of the rice plant during the grain-filling stage. Based on this, the flag leaves during the rice grain filling stage were randomly selected for the gas exchange measurement. The procedure followed the same method as mentioned in Chapter 3 using a portable Infra-Red Gas Analyzer (IRGA) photosynthesis system (LI-6800 from LI-COR Bioscience, USA) for the gas exchange measurement. The light and CO2 response curves were also carried out in this chapter to determine the photosynthetic performance. Figure 4.4 show the gas exchange measurement activity.

Figure 4.4 : Gas exchange measurement of rice flag leaves using IRGA LI-6800 during grain filling stage in the shelter structure
1.2.4.2 Relative chlorophyll content
During the grain-filling stage, the relative chlorophyll content (SPAD) of a randomly chosen flag leaf was determined (n=12). The procedures followed were mentioned in Chapter 3 (3.2.8.5).
1.2.5 Plant growth analysis and yield component
1.2.5.1 Flag leaf characteristics
During the grain-filling stage, the thickness of the fully expanded flag leaf (Figure 4.5) was measured using a thickness gauge (QST, China). The leaf thickness data was determined from the average of two leaf points at the middle section of the flag leaf. Five flag leaf blades were measured for each treatment block replication and variety. From the same flag leaf, the flag leaf length and width were also determined. The length of the flag leaf (cm) was measured using a measurement tape. The measurement starts from the base end of the panicle sheath to the tip of the flag leaf. The width of the rice flag leaf was also measured at the centre section of the leaf. For both the varieties and CO2 treatments utilised in this study, measurements were taken on a randomly chosen flag leaf.

Figure 4.5 : Rice flag leaf and panicle
1.2.5.2 Plant height, dry mass
After harvesting, 16 plants were sampled at random from each treatment for the determination of plant height and dry mass. Measurement of mature rice plant height was taken from the base to the top of the tallest panicle tip by using a measuring tape. Samples were dried using the oven (UN110, Memerth) to determine the plant dry weight (g). Before drying, the samples were washed from the dirt and soil. The plants were dried for 48 hours at 60 ͦ C. Then, the plant's root, shoot and total dry weight (g) were measured using an electronic laboratory weighing scale (AND, GH-202). The shoot-root dry weight ratio was determined.
1.2.5.3 Rice tillers and panicles
Total tillers per plant and whole panicles per plant was counted manually during the maturity stage for each treatment (n=16). Fig 4.6 below shows the rice plant tiller and panicle.

Figure 4.6 : Rice plant root, tillers, and panicles
1.2.5.4 Filled and unfilled spikelet/panicle
Seven rice panicles were selected from each of the 10 rice plants from each treatment. Dried-filled grains were separated from unfilled and partially filled grains. Filled grains, unfilled and total spikelets per panicle were counted. From the counted data, the percentage of fertilized spikelets was calculated by given calculation based on Kobata et al.(2014):
| Percentage of fertilized spikelets = [(total –sterilized spikelets)/total spikelet] x 100
| Eq. 4.1 |
1.2.5.5 1000 grain weight
16 sets of rice filled spikelets for each treatment were counted for 1000 grains using a seed counter (TRILITE, China) and then was weighed using an electronic weighing scale (AND, GH-202).
1.2.5.6 Grain yield per ha (t/ha)
The formula for estimating grain yield (t/ha) from the yield components observed is shown below and based on Fageria (2007).
| Grain yield= Number of panicles m2 × spikelet per panicle × % filled spikelet × 1000 spikelet weight (g) × 10−5 | Eq. 4.2 |
1.2.6 Data Analysis
The data obtained were analyzed and visualised using a two-sample t-test to compare the means between eCO2 and aCO2 seedlings for each variety using Microsoft 365 Excel® and GraphPad Prism Version 8. RCBD was used to cater for heterogeneity in the differential lighting and slope. However, statistical analysis using a t-test is done for comparison based on ambient and elevated CO2 treatment for each seedling variety.
1.3 Results
1.3.1 Flag leaves response to irradiance
1.3.1.1 The light response curve/ A-Q curve
One of the important key techniques for increasing agricultural output is to improve leaf photosynthesis (Simkin et al., 2019; Zhu et al., 2010). Flag leaves light response curve during the rice grain filling phase was shown in Fig 4.7A-B for MR219 and MR263, respectively. Each point on the curve with a significant difference is highlighted with an asterisk, whereas the point with no significant difference is not noted. From the curve in Figure 4.7A, eCO2 MR219 shows no significant difference with the aCO2 MR219 at all PPFD levels but there is a tendency to have a higher assimilation rate. The eCO2 MR263 flag leaves exhibited relatively significantly higher rates of photosynthesis at 600–2500 µmol photons m-2 s-1 photosynthetic photon flux density compared to ambient MR263 (Fig 4.7B). Both treatments in MR263 at 0 to 400 μmol photon m-2 s-1, shows no significant differences in CO2 assimilation rate. The flag leaves of MR219 and MR263 either ambient or eCO2 have a maximum assimilation rate of 2500 μmol photon m-2 s-1. The maximum rate of photosynthesis was 3.9% higher in eCO2 MR219 grown leaves (34.75 ± 0.79 μmol m-2 s-1) compared to aCO2 MR219 leaves (33.41 ± 3.33 μmol m-2 s-1) (Figure 4.8A). For eCO2 MR263 (37.73 ± 0.67 μmol m-2 s-1), the maximum rate of A was 33.3% higher compared to aCO2 MR219 (28.30 ± 1.16 μmol m-2 s-1) (Figure 4.8B). The general boost of A was more prominent in MR263 leaves than in MR219 CO2-enriched seedlings. However, the relative chlorophyll content data (Fig 4.8 C-D) obtained from the measurement of SPAD meter values found that there was no significant difference between eCO2 treatment and ambient for both MR219 (aCO2: 44.22 ±0.30 and eCO2: 45.15 ±0.37) and MR263 (aCO2: 46.58 ±0.36 and eCO2: 46.77 ±0.48) varieties.
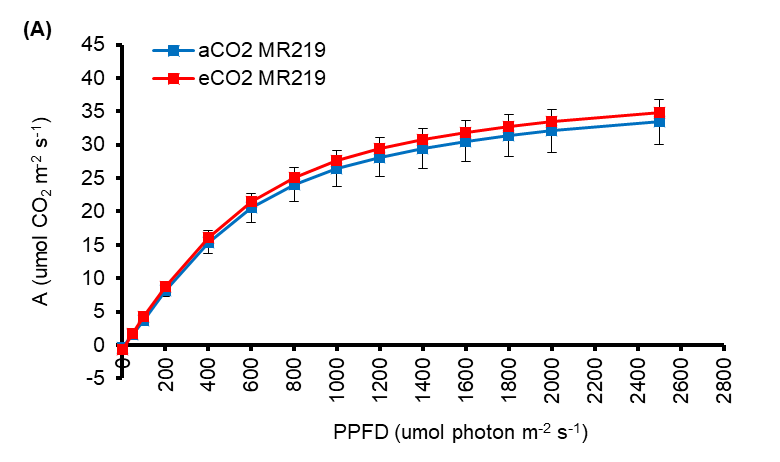

Figure 4.7 : Response curves of net assimilation rate against photosynthetic photon flux density (PPFD) (A-B) MR219 and MR263 flag leaves whose seedlings were briefly grown for 24 days in either elevated (red data points) or ambient CO2 (blue data points) condition. Vertical error bars represent the standard error of means. Student's T-test was performed for mean comparison with significant levels indicated as asterisks ** (significant at p<0.01), *(significant at p<0.05), and ns (not significant) using n=3 for all parametres. Detailed T-test analysis is presented in Appendix 15

Figure 4.8 : Maximum assimilation rate of (A-B), relative chlorophyll content (SPAD value) (C-D) in MR219 and MR263 flag leaves whose seedlings were briefly grown for 24 days in either elevated (red bars) or ambient CO2 (blue bars) conditions. Vertical error bars represent the standard error of means. Student's T-test was performed for mean comparison with significant levels indicated as asterisks ** (significant at p<0.01) and ns (not significant) using n=3 for all parametres. Detailed T-test analysis is presented in Appendix 16
1.3.1.2 Stomatal conductance (gs)
From Figure 4.9, the increases of stomatal conductance were observed when PPFD was increased from 0 to 2000 μmol photon m-2 s-1 and maintained a flat line at 2500 μmol photon m-2 s-1 for both varieties and treatments. There were no significant differences in stomatal conductance between aCO2 and eCO2 treatments for MR219 and MR263 at all PPFD levels (Figure 4.9A-B). Maximum stomatal conductance (gsmax) was recorded at 2500 μmol photon m-2 s-1 PPFD level for both varieties and treatments. The eCO2 MR219 (mean value: 0.79 µmol H2O m-2s-1) of gsmax is 6% lower than ambient (0.84 µmol H2O m-2s-1). The maximum stomatal conductance (gsmax) of eCO2 MR219 leaves was lower than that of ambient leaves, indicating that they were transpiring at a slower rate. For MR263, the eCO2 and aCO2 treatment have the same gsmax value at 0.8 µmol H2O m-2s-1.

Figure 4.9 : Response curves of stomatal conductance against photosynthetic photon flux density (PPFD) (A-B) in MR219 and MR263 flag leaves whose seedlings were briefly grown for 24 days in either elevated (red bars) or ambient CO2 (blue bars) conditions. Vertical error bars represent the standard error of means. Student's T-test was performed for mean comparison with significant levels indicated as asterisks ns (not significant) using n=3 for all parametres. Detailed T-test analysis is presented in Appendix 17
1.3.1.3 Intrinsic water use efficiency (iWUE)
The intrinsic WUE-PPFD curves of both varieties and treatments show an almost flat line with the increasing irradiance intensity (Figure 4.10A-B). T-test analysis was done for both treatments in MR219 and MR263 varieties shows no significant difference at all PPFD levels. In terms of mean values, eCO2 MR219 indicated an increase in the water use efficiency with ranges of 9-13% higher than ambient at 400 μmol photon m-2 s-1 to 2500 μmol photon m-2 s-1. The intrinsic WUEmax for both eCO2 and aCO2 MR219 was calculated at 2500 μmol photon m-2 s-1 PPFD level. The iWUEmax of eCO2 flag leaves is (43.60 ± 2.22 µmol CO2 mol H2O-1) 9.4% higher compared to aCO2 (39.81 ± 4.42 µmol CO2 mol H2O-1). As for MR263, there is a huge difference between treatments but statistically no difference as mentioned above. The eCO2 MR263 has a higher iWUE mean value range from 34-189% increase compared to aCO2. The eCO2 MR263 (47.41 ± 3.63 µmol CO2 mol H2O-1) has increased the mean value of iWUEmax by 34% compared to aCO2( 35.21 ± 0.6 µmol CO2 mol H2O-1).

Figure 4.10 : Response curves of intrinsic water used efficiency against photosynthetic photon flux density (PPFD) (A-B) in MR219 and MR263 flag leaves whose seedlings were briefly grown for 24 days in either elevated (red bars) or ambient CO2 (blue bars) conditions. Vertical error bars represent the standard error of means. Student's T-test was performed for mean comparison with significant levels indicated as asterisks ns (not significant) using n=3 for all parametres. Detailed T-test analysis is presented in Appendix 18
1.3.1.4 Quantum yield of photosystem II (ΦPSII)
The quantum yield of PSII (ΦPSII)-PPFD curves of rice flag leaves in aCO2 and eCO2 of MR219 and MR263 are shown in Figure 4.11. In both treatments, the ΦPSII-PPFD curves of MR219 and MR263 are inverse proportional functions. With increased PPFD levels, ΦPSII values for both rice varieties and treatments declined. When compared to aCO2 rice flag leaves, the eCO2 MR219 had a reduced quantum yield of photosystem II (ΦPSII), but no significant difference was obtained using t-test analysis (Figure 4.11A). When compared to aCO2, the quantum yield of photosystem II (ΦPSII) in eCO2 MR263 showed substantial differences. Except for 50, 2000, and 2500 mol photon m-2 s-1 PPFD values, MR263 with eCO2 demonstrated a significantly greater ΦPSII than aCO2 (Figure 4.11B) at P<0.05 and P<0.01 correspondingly. The eCO2 MR263 (0.165 ± 0.005) have 8.6% greater ΦPSII than aCO2 (0.152 ± 0.004) at the maximum PPFD (2500 mol photon m-2 s-1) level, whereas eCO2 MR219 (0.150 ± 0.004) have 6% lower ΦPSII than aCO2 (0.161 ± 0.003).

Figure 4.11 : Response curves of quantum yield of photosystem II against photosynthetic photon flux density (PPFD) (A-B) in MR219 and MR263 flag leaves whose seedlings were briefly grown for 24 days in either elevated (red bars) or ambient CO2 (blue bars) conditions. Vertical error bars represent the standard error of means. Student's T-test was performed for mean comparison with significant levels indicated as asterisks ** (significant at p<0.01), *(significant at p<0.05), and ns (not significant) using n=3 for all parametres. Detailed T-test analysis is presented in Appendix 19
1.3.1.5 Electron transfer rate (ETR)
Figure 4.12A-B shows the estimated ETR in MR219 and MR263 rice flag leaves whose seedlings were cultivated for 24 days in either aCO2 or eCO2 conditions for various irradiance intensities. In Figure 4.13A, the eCO2 MR219 displayed a slightly lower estimated ETR compared to aCO2 from 400 to 2500 μmol photon m-2 s-1 but statistically not significant. This was predicted since ΦPSII was lower in eCO2 rice plants than in aCO2 rice plants, as seen in Figure 4.11A. As for Figure 4.12B, MR263 exposed to eCO2 displayed a significantly higher ETR almost at all PPFD levels (from 200 to 2000 μmol photon m-2 s-1 as asterisk shown in Figure 4.12B. This was expected since, as shown in Figure 4.11B, ΦPSII was lower in aCO2 rice plants than in eCO2 rice plants. In MR219 and MR263, the ETR of both aCO2 and eCO2 increased until reaching saturating light intensity level in 1800 μmol photon m-2 s-1. Further increase in light irradiance causes a slight decrease in the estimated ETR. The mean value of MR219 maximum electron transfer rate (ETRmax) estimated for aCO2 is 172.08 μmol electron m-2 s-1 and eCO2 is 161.15 μmol electron m-2 s-1. The mean of ETRmax for aCO2 MR263 is 161.58 μmol electron m-2 s-1 and 177.3113 μmol electron m-2 s-1 for eCO2 MR263. The mean value of ETRmax for eCO2 MR219 was reduced by 6.3% to aCO2 and MR263 increased by 9.7% compared to aCO2.

Figure 4.12 : Response curves of electron transport rate against photosynthetic photon flux density (PPFD) (A-B) in MR219 and MR263 flag leaves whose seedlings were briefly grown for 24 days in either elevated (red bars) or ambient CO2 (blue bars) conditions. Vertical error bars represent the standard error of means. Student's T-test was performed for mean comparison with significant levels indicated as asterisks ** (significant at p<0.01), *(significant at p<0.05), and ns (not significant) using n=3 for all parametres. Detailed T-test analysis is presented in Appendix 20
1.3.1.6 Quantum yield of CO2 assimilation (ΦCO2)
Figure 4.13 shows both varieties and treatments quantum yield of CO2 assimilation (ФCO2) declined with rising irradiance level and showing no significant difference between aCO2 and eCO2 treatments at all PPFD levels. At the highest irradiance level (2500 μmol photon m-2 s-1), the mean value of ФCO2 for eCO2 MR219 (0.017± 001) is 5% lower than aCO2 MR219 (0.018) but for MR263, eCO2 (0.018±0.001) is 20% higher than aCO2 (0.015±0.001).

Figure 4.13 : Response curves of quantum yield of CO2 assimilation against photosynthetic photon flux density (PPFD) (A-B) in MR219 and MR263 flag leaves whose seedlings were briefly grown for 24 days in either elevated (red bars) or ambient CO2 (blue bars) conditions. Vertical error bars represent the standard error of means. Student's T-test was performed for mean comparison with significant levels indicated as ns (not significant) using n=3 for all parametres. Detailed T-test analysis is presented in Appendix 21
1.3.1.7 Relationship between quantum yields of photosystem II (ΦPSII) and CO2 fixation (ΦCO2)
The relation between ФPSII and ФCO2 under aCO2 and eCO2 treatments showed significant positive correlations (Figure 4.14A and Figure 4.14B). There was a strong linear relationship between ΦPSII and ΦCO2 and the slope was about 11.4% (MR219) and 24.7% (MR263) lower under eCO2 than aCO2 respectively. The equation in Figure 4.14A shows the ratio of 10.063 photons per CO2 fixed for eCO2 MR219 (red dots) plants. Ambient MR219 (blue dots) plants show a ratio of 11.365 photons per CO2 assimilated. Moreover, Figure 4.14B also shows the same trend as in Figure 4.14A. The equation for eCO2 MR263 (red dots in Figure 4.14B) shows that 9.3348 photons were used to fix one molecule of CO2. While for aCO2, 12.395 photons were used to fix a molecule of CO2. The eCO2 rice plants were relatively efficient at converting light energy into chemical energy.
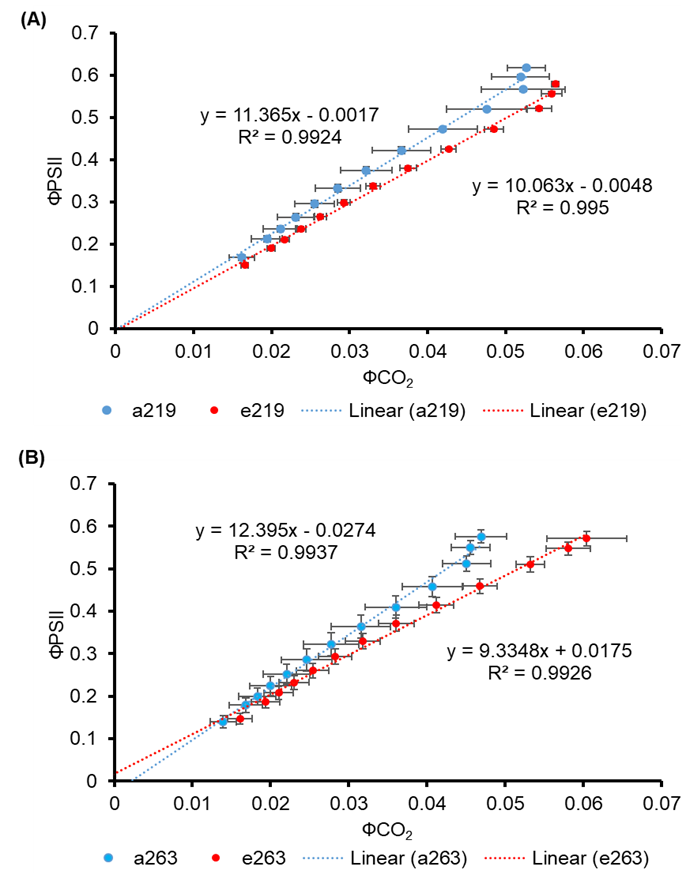
Figure 4.14 : The ratio between ΦPSII and ΦCO2 of ambient and elevated CO2 (A-B) in MR219 and MR263 flag leaves measured from light response curves. Blue data points indicate aCO2 and red data points indicate eCO2. The data for symbols are the mean of three individuals and for bars are mean ± standard error
1.3.2 The flag leaf response to CO2 concentration
1.3.2.1 The CO2 response curve/ A-Ci Curve
Gas exchange measurements were performed to assess the response of the aCO2 and eCO2 rice plants to different atmospheric CO2 concentrations. The CO2 assimilation-CO2 intercellular (A-Ci) response curves for aCO2 and eCO2 MR219 and MR263 rice flag leaves are shown in Figure 4.15A-B and 4.16A-B respectively. At ambient CO2 (400ppm) and saturating CO2 (800ppm) concentrations, eCO2 and aCO2 MR219 plants showed no significant difference in CO2 assimilation rates (A400 and Amax) measurement (Figure 4.17A and C). The values of A400 aCO2 and eCO2 MR219 are 32.04 ± 1.34 μmol CO2 m-2 s-1 and 32.72 ±0.92 μmol CO2 m-2 s-1 (2 % higher), while the values of Amax aCO2 MR219 are 43.45 ± 1.32 μmol CO2 m-2 s-1 which is slightly higher by 6% than eCO2 (40.57 ± 0.19 μmol CO2 m-2 s-1). For gas exchange measurement obtained for MR263, the A400 and Amax measured do not show a significant difference between eCO2 and aCO2 (Figure 4.17B&D, but there is a tendency to have a higher assimilation rate than aCO2. The A400 of eCO2 MR263 had an assimilation rate of 30.32±1.74 μmol CO2 m-2 s-1 which was 16.19% higher than aCO2 (26.10±0.36 μmol CO2 m-2 s-1). Amax eCO2 MR263 showed an assimilation rate of 40.91±1.90 μmol CO2 m-2 s-1 which is 15.7% higher than aCO2 (35.35±1.23 μmol CO2 m-2 s-1). The eCO2 MR219 and MR263 had a significantly higher Vcmax (Figure 4.18A-B) than aCO2, but there is no significant difference in the Jmax (Figure 4.18C-D). The eCO2 MR219 Vcmax (92.66±2.43 µmol CO2 m-2s-1) and Jmax (185.30±0.44 µmol e m-2s-1) rates are 13.17% and 1.3 % higher than aCO2 (Vcmax: 81.88±2.25 µmol CO2 m-2s-1, and Jmax: 182.98 ± 3.27 µmol e m-2s-1). Meanwhile, the eCO2 MR263 also showed an increase in Vcmax and Jmax rates at 17.9%% (92.04±2.81 µmol CO2 m-2s-1) and 14.1% (180.86±6.58 µmol e m-2s-1) higher than aCO2 (Vcmax: 78.06±2.19 µmol CO2 m-2s-1, and Jmax: 158.52±3.26 µmol e m-2s-1)

Figure 4.15 : Assimilation versus intercellular CO2 (A-Ci) response curves for (A) ambient CO2 and (B) elevated CO2 of MR219. Measurements were carried out on attached fully developed flag leaves at 27 ◦C and at saturating irradiance of 2000 μmol m−2 s−1 PPFD. Data points are averaged from three rice plants for each treatment. Ac (blue/red dashed lines) are CO2 assimilation rates limited by the amount and activity of Rubisco (enzyme limited/RuBP saturated). Aj (blue/red solid lines) are CO2 assimilation rate limited by RuBP regeneration (light-limited/RuBP limited). Error bars show the standard error of the mean

Figure 4.16 : Assimilation versus intercellular CO2 (A-Ci) response curves for (A) ambient CO2 and (B) elevated CO2 of MR263. Measurements were carried out on attached fully developed flag leaves at 27 ◦C and at saturating irradiance of 2000 μmol m−2 s−1 PPFD. Black-colored data points are averaged from three rice plants for each treatment. Ac (blue/red dashed lines) are CO2 assimilation rates limited by the amount and activity of Rubisco (enzyme limited/RuBP saturated). Aj (blue/red solid lines) are CO2 assimilation rate limited by RuBP regeneration (light-limited/RuBP limited). Error bars show the standard error of the mean

Figure 4.17 : Assimilation rate at 400 ppm CO2 of (A-B), the maximum assimilation rate of (C-D) in MR219 and MR263 flag leaves whose seedlings were briefly grown for 24 days in either elevated (red bars) or ambient CO2 (blue bars) conditions. Vertical error bars represent the standard error of means. Student's T-test was performed for mean comparison with significant levels indicated as ns (not significant) using n=3 for all parametres. Detailed T-test analysis is presented in Appendix 22

Figure 4.18 : Maximum Rubisco carboxylation rate (Vcmax)(A-B), maximum light and CO2 saturated electron transport rate (Jmax) (C-D) in MR219 and MR263 flag leaves whose seedlings were briefly grown for 24 days in either elevated (red bars) or ambient CO2 (blue bars) conditions. Vertical error bars represent the standard error of means. Student's T-test was performed for mean comparison with significant levels indicated as asterisk *(significant at p<0.05), and ns (not significant) using n=3 for all parametres. Detailed T-test analysis is presented in Appendix 23

Figure 4.19 : Horizontal bar charts as a summary for percentage changes in photosynthesis performance of MR219 (red bars) and MR263 (blue bars) flag leaves whose seedlings were briefly grown for 24 days in response to elevated CO2 against aCO2 treatment. The response ratio was calculated as a relative variation of each parameter under elevated CO2 treatment using the ambient CO2 as a control. Value bars facing the left and right indicate decreases and increases in properties compared to the value of ambient CO2 treatment, respectively. Amax, maximum net photosynthesis rate; gsmax, maximum stomatal conductance; iWUEmax, maximum intrinsic water use efficiency; ΦPSII2500, the maximum photochemical quantum yield of PSII at PPFD 2500 μmol photon m-2 s-1; ETRmax, maximum electron transport rate; ΦCO2,2500, the maximum quantum yield of CO2 assimilation at PPFD 2500 μmol photon m-2 s-1; Jmax, maximum light and CO2 saturated electron transport rate; Vcmax, maximum Rubisco carboxylation rate; A400, net assimilation rate at 400ppm CO2
1.3.3 Rice growth properties and yield component
Figure 4.20 shows the condition of the aCO2 and eCO2 MR219 and MR263 rice plants during the grain filling stage at 90 DAS. The rice plants grow well inside the structures on the farm and there is minimal and controlled pest infestation. Through observation, the MR263 plant structure is higher than MR219. However, between treatments, eCO2 treatment for both varieties can be seen to be relatively shorter than aCO2.

Figure 4.20 : The aCO2 and eCO2 MR219 and MR263 rice plants during the grain filling stage (90 DAS)
1.3.3.1 Flag leaves properties
All t-test analyses found no significant difference between aCO2 and eCO2 treatments (Figure 4.21), except for flag leaf length attributes in MR263 (Figure 4.21D), which indicated a significant difference between treatments at P<0.001. The leaf length of eCO2 MR263 (27.25±3.07 cm) was 24.7% longer than that of aCO2 MR263 (22.05±1.93 cm). The MR219 flag leaf length, eCO2 (25.5±1.70 cm), and aCO2 (26.25±1.84 cm) were all almost identical. Leaf thickness was found to be almost identical to 0.28mm for both aCO2 and eCO2 MR219 and 0.27mm for aCO2 and eCO2 MR263. The flag leaf width for both aCO2 and eCO2 MR219 was 1.31 cm, while for aCO2 and eCO2 MR263, it was 1.23 cm.

Figure 4.21 : Thickness of flag leaves (A-B), length of flag leaves (C-D) and width of flag leaves (E-F) in MR219 and MR263 flag leaves whose seedlings were briefly grown for 24 days in either elevated (red bars) or ambient CO2 (blue bars) conditions. Vertical error bars represent the standard error of means. Student's T-test was performed for mean comparison with significant levels indicated as asterisk ***(significant at p<0.001), and ns (not significant) using n=20 for all parametres. Detailed T-test analysis is presented in Appendix 24
1.3.3.2 Plant height and biomass
Fig 4.22A shows significant 5% and 6% shorter rice plant height recorded for eCO2 treatment on MR219 (82.81±0.94 cm) and MR263 (73.38±0.85 cm) than aCO2 MR219 (87.25±0.82 cm) and MR263 (78±0.83 cm). No significant differences in plant dry mass between aCO2 and eCO2 treatments were observed for both varieties, as presented in Figure 4.22B. Both aCO2 and eCO2 MR219 recorded plant dry mass of 59.77±1.46 g/plant and 59.83±0.71 g/plant while aCO2 and eCO2 MR263 were 57.26±0.86 g/plant and 57.04±0.65 g/plant. The shoot-root ratios of aCO2 and eCO2 for both varieties were not significantly different. Both aCO2 and eCO2 MR219 measured shoot-root ratios were 2.04±0.12 and 2.07±0.08 while aCO2 and eCO2 MR263 were 2.08±0.14 and 2.30±0.11.

Figure 4.22 : Plant height (A-B), plant dry mass (C-D) and shoot/root ratio (E-F) in MR219 and MR263 flag leaves whose seedlings were briefly grown for 24 days in either elevated (red bars) or ambient CO2 (blue bars) conditions. Vertical error bars represent the standard error of means. Student's T-test was performed for mean comparison with significant levels indicated as asterisk ***(significant at p<0.001), ** (significant at p<0.01), and ns (not significant) using n=16 for all parametres. Detailed T-test analysis is presented in Appendix 25
1.3.3.3 Yield component
Figure 4.23 shows the differences in panicles and tillers between aCO2 and eCO2 treatments for MR219 and MR263. A T-test revealed a significant difference in MR219 panicle and tiller characteristics between CO2 treatments at P<0.05 (Figure 4.23A&C). In the case of MR263, however, statistically, there were no significant variations in tiller-panicle characteristics between the aCO2 and eCO2 treatments (Figure 4.23B&D). The eCO2 MR263 had the most tillers per plant (15.25±0.9) and eCO2 MR219 (13.69±0.41 tiller per plant), followed by the aCO2 MR263 (13.56±0.5 tillers per plant), and the aCO2 MR219 (12.13±0.46 tillers per plant). The number of tillers per plant rose by 11.5% in MR219 and 12.5% in MR263 in the eCO2 treatment compared to the aCO2. As shown in Figure 4.22 C-D, eCO2 MR263 (13.13±0.75 panicles per plant) had the most panicles per plant, followed by eCO2 MR219 (12.94±0.42 panicles per plant), aCO2 MR219 (11.75±0.36 panicles per plant) and aCO2 MR263 (11.69±0.53 panicles per plant). The number of panicles per plant rose by 10.1% (MR219) and 12.3% (MR263) with eCO2 treatment compared to aCO2 plants.

Figure 4.23 : Rice tiller number/plant (A-B) and panicle number/plant (C-D) in MR219 and MR263 flag leaves whose seedlings were briefly grown for 24 days in either elevated (red bars) or ambient CO2 (blue bars) conditions. Vertical error bars represent the standard error of means. Student's T-test was performed for mean comparison with significant levels indicated as asterisk *(significant at p<0.05) and ns (not significant) using n=16 for all parametres. Detailed T-test analysis is presented in Appendix 26
In eCO2, MR219 (102.14±3.70 filled grain per panicle) and MR263 (106.19±4.22 filled grain per panicle) had significantly greater filled grain per panicle than aCO2 MR219 (89.73±3.83 filled grain per panicle) and MR263 (83.34±4.23 filled grain per panicle), respectively, at P<0.05 and P<0.001 (Figure 4.24A-B). The eCO2 enhanced the number of filled grains per panicle by 13.8% (MR219) and 27.4% (MR263) as compared to aCO2. A significant higher unfilled grain per panicle was observed in aCO2 for MR219 (26.86±1.88 unfilled grain per panicle) and MR263 (50.37±1.87 unfilled grain per panicle) than eCO2 MR219 (27±1.20 filled grain per panicle) and MR263 (40.51±2.16 filled grain per panicle), both at P<0.001 respectively (Figure 4.24C-D). In comparison to aCO2, eCO2 reduced the number of empty grains per panicle by 26.7% (MR219) and 19.6% (MR263). For MR219 and MR263 variety, the total number of spikelets per panicle was greater in the eCO2 treatment (Figure 4.24E-F). For MR219, eCO2 had a greater panicle number (129.143.33 spikelets per panicle) than aCO2 (126.593.52 spikelets per panicle), but the difference was not significant. The eCO2 enhanced the number of spikelets per panicle by 2% more than aCO2. For MR263, the highest spikelet per panicle was for eCO2 (146.7±3.98 spikelets per panicle) compared to aCO2 (133.71±4.39 spikelets per panicle). In comparison to aCO2, the eCO2 treatment increased by 9.7%. A higher rate of fertilized panicle % was obtained in eCO2 MR219 (77.81±1.23%) and eCO2 MR263 (71.31±1.53%) compared to aCO2 MR219 (69.32±1.71%) and MR263 (60.51±1.60%)(Figure 4.24G-H). A significant increase was observed between eCO2 and aCO2 in both MR219 (12.24%) and MR263 (17.85%) at P<0.001.
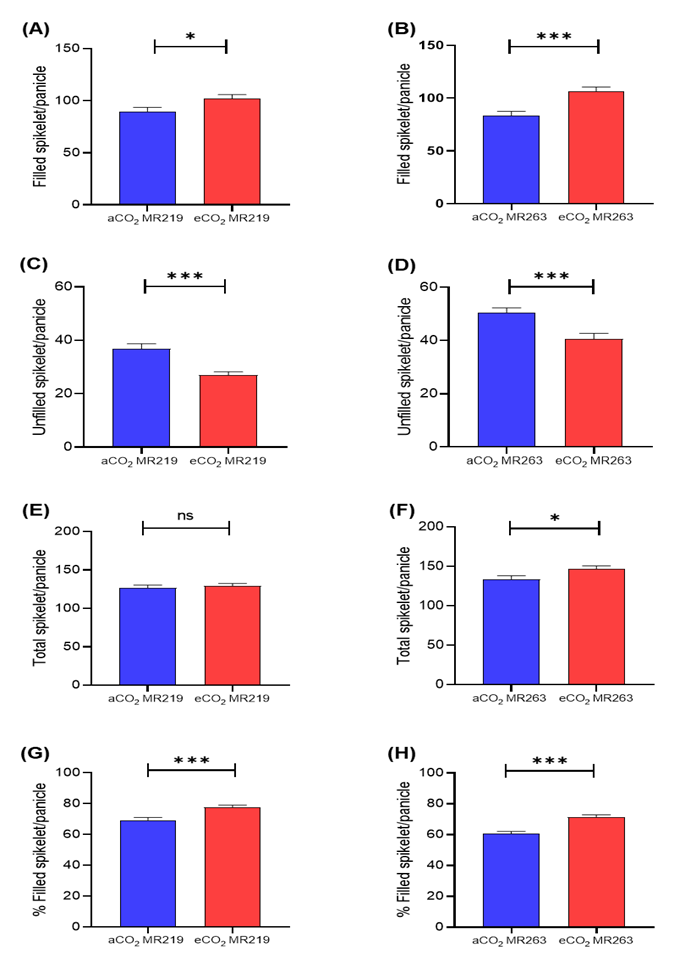
Figure 4.24 : Filled spikelet/panicle (A-B), unfilled spikelet/panicle (C-D), total spikelet/panicle (E-F), filled spikelets/panicle % (G-H) in MR219 and MR263 flag leaves whose seedlings were briefly grown for 24 days in either elevated (red bars) or ambient CO2 (blue bars) conditions. Vertical error bars represent the standard error of means. Student's T-test was performed for mean comparison with significant levels indicated as asterisk ***(significant at p<0.001), *(significant at p<0.05) and ns (not significant) using n=70 for all parametres. Detailed T-test analysis is presented in Appendix 27
There were significant differences in 1000-grain weight between CO2 treatments at P<0.01 for both varieties (Figure 4.25C-D). Greater 1000 grain weight was recorded in eCO2 MR219 (27.71±0.19 g) and eCO2 MR263 (25.95±0.18 g) compared to aCO2 MR219 (26.95±0.14 g) and aCO2 MR263 (25.12±0.16 g). The 1000-grain weight of eCO2 treatments was increased by 2.8% and 3.3% compared to the aCO2. In terms of grain yield potential, there are no significant differences in potential yield for aCO2 and eCO2 treatments were identified (Figure 4.25 E-F). The eCO2 treatment has increased the potential yield at 4.1% for MR219 and 7.1% for MR263 compared to aCO2. The potential yield was calculated in eCO2 MR219 (3.04±0.11 t/ha) and eCO2 MR263 (2.84±0.11 t/ha). The aCO2 MR219 recorded potential yield was 2.92±0.10 t/ha and MR263 2.65±0.09 t/ha.

Figure 4.25 : 1000 grain weight (A-B), potential yield (C-D) in MR219 and MR263 flag leaves whose seedlings were briefly grown for 24 days in either elevated (red bars) or ambient CO2 (blue bars) conditions. Vertical error bars represent the standard error of means. Student's T-test was performed for mean comparison with significant levels indicated as asterisk **(significant at p<0.01) and ns (not significant) using n=16 for all parametres. Detailed T-test analysis is presented in Appendix 28

Figure 4.26 : Horizontal bar charts as a summary for percentage changes in flag leaves properties, morphology and yield components of MR219 (red bars) and MR263 (blue bars) in response to eCO2 against aCO2 treatment
1.3.4 Correlation Analysis
In addition, correlation analysis was performed among the photosynthetic properties, leaf and morphology traits, and yield components for both MR219 (Figure4.27) and MR263 (Figure 4.28) flag leaves and paddy yield. The analysis revealed that there were no meaningful relationships between the yield components with either flag leaf morphology or photosynthetic pararameters for the MR219 variety (Figure 4.27).
However, Pearson’s correlation analysis for MR263 (Figure 4.28) had a significant strong positive correlation involving yield components such as panicle numbers with photosynthesis properties such as gsmax (R=0.84, P<0.05) and 1000 grain weight when being compared against Amax (R=0.89, P<0.05), ΦCO2max (R=0.88, P<0.05), Vcmax (R=0.87, P<0.05)and Jmax (R=0.81, P<0.05). Moreover, the shoot-root ratio also showed a similar pattern with a significant positive correlation with the photosynthetic properties such as ΦPSIImax (R=0.93, P<0.01) and ETRmax (R=0.93, P<0.01).

Figure 4.27 : Correlation heat map analysis among the photosynthetic properties, biomass and leaf characters, and yield components of MR219 flag leaf (25-DAS) and paddy yield upon harvest. Note: Amax: Maximum net assimilation rate, gsmax: maximum stomatal conductance, iWUEmax: maximum intrinsic water use efficiency, ΦPSIImax: the maximum photochemical quantum yield of PSII, ETRmax: maximum electron transport rate, ΦCO2max: the maximum quantum yield of CO2 assimilation, Jmax: maximum light and CO2 saturated electron transport rate, Vcmax: maximum Rubisco carboxylation rate, A400: net assimilation rate at 400 ppm CO2, LL: Leaf Length, LW: Leaf Width, LT: Leaf Thickness, TDW: Total dry weight, S/R ratio: Shoot Root Ratio, PH: Plant Height, T Spik.: Total Spikelet, 1000 GW: 1000 grain weight, P. Yield: Potential Yield. Values are Pearson correlation coefficients, which are used to construct the heat map. , * or *** represent a significant difference with the parameters of P < 0.05, P<0.01 and P < 0.001, respectively

Figure 4.28 : Correlation heat map analysis among the photosynthetic properties, biomass and leaf characters, and yield components of MR263 flag leaf (25-DAS) and paddy yield upon harvest. Note: Amax: Maximum net assimilation rate, gsmax: maximum stomatal conductance, iWUEmax: maximum intrinsic water use efficiency, ΦPSIImax: the maximum photochemical quantum yield of PSII, ETRmax: maximum electron transport rate, ΦCO2max: the maximum quantum yield of CO2 assimilation, Jmax: maximum light and CO2 saturated electron transport rate, Vcmax: maximum Rubisco carboxylation rate, A400: net assimilation rate at 400 ppm CO2, LL: Leaf Length, LW: Leaf Width, LT: Leaf Thickness, TDW: Total dry weight, S/R ratio: Shoot Root Ratio, PH: Plant Height, T Spik.: Total Spikelet, 1000 GW: 1000 grain weight, P. Yield: Potential Yield. Values are Pearson correlation coefficients, which are used to construct the heat map. , * or *** represent a significant difference with the parameters of P < 0.05, P<0.01 and P < 0.001, respectively
1.4 Discussion
Modern varieties such as MR263 (released in 2010) can retain the memory of CO2 enhancement during seedling compared to older varieties (MR219 released in 2001). MR263 has not received a high amount of eCO2 for about 3 months but remained to have high CO2 enhancement properties by maintaining a higher CO2 assimilation rate, water use efficiency, ΦPSII, ETR, ΦCO2 and Jmax compared to ambient (Figure 4.19). Although the stomatal conductance of eCO2 MR263 showed no significant difference with aCO2 (Figure 4.9), the high rate of CO2 assimilation resulted in high intrinsic water use efficiency levels. Data also showed that eCO2 MR219 got a minimal increase in CO2 assimilation rate (Figure 4.7-A) and water use efficiency (Figure 4.10-A) while other physiological properties such as ΦPSII, ETR, ΦCO2, and Jmax were reduced compared to ambient (Figure 4.19). However, both eCO2 MR219 and MR263 show higher carboxylation efficiency (Vcmax) (Figure 4.18 and 4.19) and better efficiency in the rice plants to utilize absorbed light energy to assimilate CO2 due to lower photorespiration rates such as shown at a lower ΦPSII/ΦCO2 ratio (Figure 4.19) as mentioned by Singh & Reddy (2018).
The relationship between quantum PSII (ΦPSII) and ΦCO2 can be a good photorespiration indicator because photorespiration can negatively impact the efficiency of photosynthesis and the quantum yield of PSII in plants. Photorespiration occurs when oxygen molecules instead of carbon dioxide molecules bind to the active site of the enzyme Rubisco, which is responsible for fixing CO2 during photosynthesis. This reaction results in the production of toxic compounds that need to be metabolized at the expense of ATP and reducing power, thus decreasing the efficiency of photosynthesis and the quantum yield of PSII. ΦPSII is a measure of the efficiency of light energy conversion in photosynthesis, while ΦCO2 represents the efficiency of CO2 uptake by the plant. The relationship between ΦPSII and ΦCO2 can be used as an indicator of photorespiration because a decrease in CO2 availability can exacerbate photorespiration, leading to a decrease in the quantum yield of PSII. When the CO2 concentration is low, the oxygenase activity of Rubisco increases, leading to a higher rate of photorespiration. This, in turn, results in a decrease in ΦPSII and ΦCO2. Therefore, the ratio of ΦPSII to ΦCO2 can be used to estimate the extent of photorespiration occurring in the plant. In C3 plants, which are more susceptible to photorespiration, monitoring the relationship between ΦPSII and ΦCO2 can be particularly useful as Rubisco has a low affinity for CO2. Under stress conditions, such as drought or high temperature, the ratio of ΦPSII to ΦCO2 may decrease, indicating a higher rate of photorespiration and reduced photosynthetic efficiency. Monitoring this relationship can help identify strategies to improve crop productivity under stressful conditions and can provide valuable information on the occurrence and severity of photorespiration in plants, which can have significant implications for plant productivity and carbon cycling in ecosystems.
The quantity and kinetics of the Rubisco enzyme affect Vcmax (Sage et al., 2008). Vcmax is regulated by climatic circumstances, leaf ontogeny, and plant development phases and varies across and among plant functional types (Croft et al., 2017; Smith et al., 2019). The equation derived from Fig 4.14 shows that eCO2 MR219 plant flag leaves required 10.06 photons (11.4% lower) to fix one CO2 molecule and 11.37 photons for the ambient while eCO2 MR263 used 9.33 photons (24.7% lower) compared to ambient MR263 which used 12.39 photons to fix one CO2 molecule.
MR219 got very minimal physiological retainment that happens at a much later stage, indicating that the old variety is more adapted to the old environment (lower CO2 level in the environment). It could be modern variety has a degree of climate-ready in future high CO2 environment. Development of a rice variety takes about 10 years period and the development of the MR219 variety was carried out around 1990-2000. The CO2 level at that time was at 350-370 ppm based on data from the Global Monitoring Laboratory in Mauna Loa (NOAA Research, 2021). The development of the MR263 variety was carried out in the year 2000-2010 and the CO2 level recorded at that time was between 370-390 ppm which is higher than the previous year. This may be one point of evidence of the readiness of modern varieties such as MR263 to adapt to conditions of high CO2 levels condition compared to MR219. According to Leakey et al. (2009), C3 photosynthesis rises with eCO2 treatment, however, the strength of the reaction varies depending on the stage of development of the crop and the surrounding environment. Early vegetative stages of plants respond to eCO2 significantly more strongly than later vegetative stages (P. S. Seneweera et al., 2002). Work done by J. Li et al. (2008) reported that a fully expanded sixth leaf of rice seedling exposed to short-term eCO2 (700ppm) had significantly increased CO2 assimilation rate, photosynthate accumulation, enzyme actions, sucrose synthase and gene expression of the next developing leaves compared to ambient (350 ppm). The growth and sink-source transition of fresh developing sink leaves is hastened as a result of these features.
During the maturity period, the rice plants exposed to eCO2 during the seedling stage exhibited non-significant differences in terms of the flag leaves properties (thickness, length and width) except for eCO2 in MR263 flag leaves length which significantly exhibited an increase of 24.7% (Figure 4.26). This may be due to enhanced photosynthetic capacity and gas exchange in the flag leaves of eCO2 MR263 as reported in this chapter. Enhanced photosynthetic rates at eCO2 lead to higher sugar production across a wide variety of plant species (Aranjuelo et al., 2015) and can be used to grow new sink organs like leaves, tillers, and grains. The final growth response to eCO2 is determined by the developmental flexibility of these organs (Gamage et al., 2018). Sink activity is a major determinant of ontological difference, which differs with species and environmental circumstances (J. Li et al., 2008). In rice plants, the primary driver of the grain filling stage is the photosynthesis activity in the flag leaves (Yoshida, 1981) and many findings indicated that high photosynthetic activity in the flag leaves affects the grain output (Carmo-silva et al., 2017 and Honda et al., 2021).
General morphology character, such as final plant height was reduced by 5-6% for both rice varieties of eCO2 plants. According to Berry (2013), shorter plant structures have shown to be particularly successful in reducing lodging risk and maintaining consistent production gains. These findings are different from those reported in Chapter 3 which eCO2 seedlings for both varieties were significantly enhanced than ambient. This may be due to the exposure to the eCO2 condition which had increased the rates of cell division and expansion activity during the vegetative phase (evidenced by the higher seedlings length in Table 3.4) and accelerated the transition to the reproductive phase. After 24 days of exposure to eCO2 and subsequently transferred to the ambient environment, the growth rate may have decreased or stopped growing and the plant development was focused on the reproductive phase. Jitla et al. (1997) discovered that eCO2 treatment only enhanced growth rates during the early stages of development and that the relative growth rate tapered down faster with eCO2 exposure. This indicates that with eCO2 treatment, the pace of growth of leaves on tillers and main shoots was higher, but the period of elongation was shorter. Observations from the experiment found that the rice plants heading (rice panicle exertion) stage was 4-5 days earlier for eCO2 than ambient. It was documented by Jagadish et al. (2016) stated that eCO2 has a role in the regulation of flowering time which involves several key flowering genes. According to Jagadish's report, 28 cases were showing earlier flowering time (an average of 8.6 days) when exposed to eCO2. These findings indicate that rice plant growth is enhanced under eCO2 treatment at an early stage. This causes the eCO2 plants quickly enter the next phase and focus on the growth of the reproductive phase. This in turn will speed up the maturation period and this feature is important to reduce the risk of crop damage on the farm.
The early eCO2 exposure to the seedlings significantly enhanced tiller-panicle properties, the spikelets quality and quantity (filled, unfilled, total spikelets and 1000-grain weight). The early exposure of the seedlings to eCO2 stimulates early leaf growth and boosted the number of tiller buds developments. The tiller numbers increased significantly by 11.5% (MR219) and 12.5% (MR263) and panicles by 10.1% (MR219) and 12.3% (MR263) compared to aCO2 plants. These findings are also reported to be similar to those reported by Jitla et al. (1997) mentioned that the formation of new tillers begins when the associated leaf stops growing. Thus, the rate of leaf growth is crucial to the activity of tiller growth. As a result, the faster a leaf grows to its mature phase, the faster the tillers emerge. Each productive tiller produced spikelets, and eCO2 increased grain yield per plant. The filled spikelets numbers and % of filled spikelets were enhanced by 13.8% and 12.2% in eCO2 MR219 while eCO2 MR263 improved by 27.4% and 17.95 compared to ambient. Rice potential yields increased by 4-7% when exposed to an early eCO2 treatment and this was suggested due to an increase in tiller and panicle numbers. The higher grain production under eCO2 was also due to a 2-7% increase in total spikelets per panicle and a 2.8-3.3% increase in average 1000-grain weight, demonstrating that the development of sinks in the floral apex and endosperm of the grain also plays a role in determining grain output. Similar findings have been observed in other eCO2 treatments on rice experiments such as reports by Seneweera et al. (1994) and Kim et al. (2001).
There are various seedling priming techniques mentioned by Garcia et al. (2021) and through this technique, it is reported that it is capable of improving the morphophysiological pattern, regulating phytohormones, reprogramming gene expression, and inducing the metabolism of important enzymes. According to Shi et al. (2020), one of the key characteristics and desirable traits that contribute to high output capacity is effective seedling early vigour, which means faster seedling establishment and faster development in the early stages. Hanley et al. (2004) describe early vigour as a seedling and post-seedling plant development with the former being predominantly influenced by seed reserves and subsequently by photosynthesis capacity and nitrogen uptake. This study clearly shows that seedlings exposed to early-stage eCO2 have also been able to positively enhance seedling early vigour (as mentioned one of the traits desired for high yielding crop) thereby improving physiological properties, plant development effects as well as crop yields.
1.5 Conclusion
In general, this experiment reveals that early-stage eCO2 exposure to rice seedlings can enhance the plant's early vigour, photosynthetic performance and yield potential. However, different rice varieties have different capacities to retain increased CO2 memory that have been exposed in the early stages of growth for example for the photosynthetic characteristics. Based on the findings of this study, in the presence of this feature on MR263, it is suggested the possibility that modern rice has a degree of climate-ready in the future high CO2 environment. Furthermore, even though both rice varieties were no longer treated with eCO2, their yield components can increase dramatically after being transplanted into the field. After being transplanted onto a netted structure, the vigour seedlings treated with eCO2 were perform better and provide a yield increase than the non-treated (ambient) seedlings. Early exposure to eCO2 at the seedling stage is also able to reduce the plant height structure which is a good feature to reduce the risk of lodging in the field and speed up rice harvesting due to the earlier maturity of rice plants compared to untreated plants. Finally, this experiment revealed some beneficial impacts on rice photosynthesis performance and yield components. As a result, applying eCO2 to rice seedlings before field cultivation is seen to be a promising strategy that farmers might utilise to increase rice output. This novel growing approach may help farmers not only cultivate high-yield rice to meet the demand for rice, but also enhance their income and improve their living conditions.


Comments