

Chapter 3: THE ENHANCEMENT OF FUNDAMENTAL PHOTOSYNTHETIC PROPERTIES, GROWTH AND YIELD IN MR219 AND MR263 RICE VARIETIES VIA EARLY-STAGE CO2 ENRICHMENT TO THE SEEDLINGS BEFORE TRANSPLANTING (THESIS)
- PlantHouse Enterprise
- Apr 2
- 44 min read

1.1 Introduction
Carbon dioxide is one of the most prevalent gases in the earth's atmosphere and plays a critical role in the plant, especially in photosynthesis (Goel & Agarwal, 2014). Typically, C3 photosynthesis rises with eCO2, but the extent of the reaction might vary depending on the stage of plant growth and the local environment (Leakey et al., 2009). Additionally, a variety of plant species produce more glucose, fructose, and raffinose when photosynthesis rates are increased at eCO2 (Aranjuelo et al., 2015). These extra sugars can be used to create new sink organs like grains, leaves, stems, and tillers. The final growth response to eCO2 is determined by the developmental flexibility of these organs. However, compared to later stages of vegetative growth, early vegetative stages show substantially larger plant responses to eCO2 (Seneweera et al., 2002). This ontological variance varies with species and environmental factors and is mostly influenced by sink activity (J. Y. Li, Liu et al., 2008).
According to Hilker et al.(2015), the term ‘priming’ refers to the capacity of organisms to react to environmental stimuli in a manner that prepares them for a better response to future stresses. This capability permits the organisms to modify their physiological or developmental phenotype in response to their surroundings, which has an impact on the organism's performance in the future. Priming can be carried out at any plant developmental phase and to various plant parts, but the most widely used approach is seed priming or less often applied during the seedling stage when plants are in active growth phases (Wiszniewska, 2021). The age of plants exposed to a priming stimulus may influence how much time it devotes to stress response priming (Hilker et al., 2015). According to Sani et al. (2013), primed A. thaliana during early seedlings with salt stress increased the mature plants' responsiveness to salt and drought stress conditions. Biological priming procedures are phenomena including systemic acquired resistance (Kachroo & Robin, 2013; Zeier, 2013), hardening (Hincha & Zuther, 2014), induced systemic resistance (Ent et al., 2009; Pozo et al., 2009), osmopriming, and thermopriming (Lemmens et al., 2019; Sadeghi et al., 2011). Moreover, abiotic stimulus primings such as using salt and drought stressors are also practical priming approaches (Ding et al., 2012; Sani et al., 2013).
There is still a lack of findings related to targeted priming using elevated CO2 on early-stage rice seedlings of local varieties. Hence, this chapter's objective is to evaluate how eCO2 influences rice seedling establishment before they could be transplanted into the field for MR219 and MR263 rice varieties.
1.2 Materials and methods
1.2.1 Seed materials
Plant materials used in this study were rice (Oryza sativa L.) seeds of varieties MR219 (accession no: MRGB11633) and MR263 (accession no: MRGB12133) provided by Genebank and Seed Centre, MARDI.
1.2.2 Plant growth and maintenance
Seeds were soaked in distilled water for about 24 hours, after which floating seeds were discarded. The sunken seeds were placed on a petri dish lined with a wet paper towel for the germination of plumule and radicle, which would take around 2-3 days. Three rice seedlings were then transferred to a 30 ml size plastic cup filled with three-quarters of the standard soil media mixture (3:2:1) in the chamber with two different CO2 concentrations, namely: high (~800 ppm) and ambient (~ 400 ppm). On the 5 and 15 days after sowing (DAS), a mixture of 1 g of NPK 15:15:15 and 1 g urea fertilizer was placed in each cup. Each plastic container maintained the submerged soil condition with 2-3 cm water depth until day 25 DAS.
1.2.3 Chamber location and facilities
The experiment was conducted at the Crop Science Department, University Putra Malaysia in December 2018. The floor space required for the growth chamber was 2.5 m (W) x 2.5 m (D). The growth chamber was located in the Plant Physiology Lab with a controlled temperature of 27±3°C.
1.2.4 Chamber structure
Two plant growth chambers were constructed for this experiment. The dimension of both chambers was 63 cm in length, 47 cm in-depth, and 60 cm in height constructed with polyvinyl chloride (PVC) pipe extension as means of extended confinement using transparent plastic. Both chambers were placed on a stainless-steel rack (Figure 3.1A and Figure 3.2).
1.2.5 Chamber light setup
Twelve units of 30 watts, 1.2-meter T8 LED grow light with a red and blue LED colour ratio of 3:1, and one supplemental unit of white colour 16-watt T5 LED light was used as growth light (Figure 3.1B). The growth light was mounted 50 mm above the chamber's top surface. The light was set for a 12-hour photoperiod length from 7.00 am to 7.00 pm.

Figure 3.1 : (A) Elevated CO2 and control chambers set up for the experiment using a modified storage box illuminated with (B) custom LED growth light setup

Figure 3.2 : Schematic illustration of the elevated CO2 (left) and control chambers (right)
1.2.6 CO2 exposure method
The fermentation method using a mixture of 600 g sugar, 1.5 l distilled water, and a packet of 11 g baker's yeast (Saccharomyces cerevisiae) (Onofre et al., 2017) in a 2.7 l plastic bottle was used to generate high CO2 condition (eCO2). The solution mixture could generate CO2 gas ranging from 800 to1200 ppm (Figure 3.4A) for about ten days before the need for a new fermentation set-up. The use of baker's yeast as a CO2 source has several advantages over other methods of generating elevated CO2, such as using CO2 cylinders or scrubbers. Baker's yeast is inexpensive, widely available, and easy to use. It does not require any special equipment or technical expertise to set up and can be used in both small-scale and large-scale experiments. Additionally, the CO2 generated by yeast is of high purity and free of impurities that may affect plant growth and development.
However, there are some limitations to using baker's yeast as a CO2 source. The amount of CO2 generated by yeast is not as precise as other methods, and the rate of CO2 release may vary depending on the amount of sugar available and other environmental factors such as temperature and humidity. Therefore, careful monitoring and adjustments may be required to maintain consistent CO2 levels throughout the experiment. Both chambers were covered with transparent plastic at the top, but for the eCO2 chamber, there was a small opening (47 cm length x 5 cm width) mad at the top to maintain CO2 from building up excessively. The ambient chamber (aCO2) was equipped with exhaust fans to maintain a typical ambient 400±50 ppm CO2 concentration (Figure 3.2).
1.2.7 Chamber environmental profile
A spectrometer (LI-180 Licor, Lincoln, Nebraska, USA) was used to measure the light spectrum and intensity inside the plant growth chambers in Figures 3.1 and 3.2. The spectrum (Figure 3.3A) and intensity (Figure 3.3B) were measured approximately 20 cm below the LED light source. The environmental condition readings inside the chamber, including the concentration of CO2 (Figure 3.4A), temperature (Figure 3.4B), and relative humidity (Figure 3.4C), were recorded and monitored using a data logger (Century Harvest, Model TH2000). Figure 3.4D shows the average value of the environmental profile during day and night time for the chambers.

Figure 3.3 : (A) Spectrum properties with the highest peak wavelength at 660 nm and 460 nm (B) PFD measured at 20 cm distance from the light source value : PFD-R (600~700 nm wavelength range), PFD-G (500~600 nm), PFD-B (400~500 nm), PFD-UV (80~400 nm), PFD-FR (700~780 nm). Total PPFD measured was 484 μmol m-2 s-1

Figure 3.4 : Chamber environmental profile, (A) CO2 concentration, (B) temperature, (C) relative humidity and (D) average value of the environmental conditions during day and night time for the chambers. The data logger inside the chamber recorded readings for 7 days with error bars in the graphs showing standard errors of the means. Closed circle (●) represent data from the ambient CO2 chamber while open circle (○) represent data from the elevated CO2 chamber. The shaded background area indicates times when lights were off or night-time and the white background area indicates lights were on
The 25 DAS eCO2 and aCO2 seedlings (replications mentioned in Chapter 4) are then transplanted to the semi-field condition and let to grow until harvest in continuation, which was also the basis for the second experiment (Figure 3.5).

Figure 3.5 : Summary of the application of elevated CO2 treatment for the first experiment (Chapter 3) and second experiment (Chapter 4)
1.2.8 Seedlings’ vegetative growth traits
1.2.8.1 Plant height
At 24 DAS plants were sampled at random from each treatment for the determination of various vegetative parameters (n=7). Measurement of plant height was taken from the ground of the soil in the plastic cup to the highest shoot tip by using a measuring tape.
1.2.8.2 Leaf number
Leaf number was manually counted on the fully expanded leaves at 24 DAS (n=7). This was signified by the presence of a collar joint between the leaf blade and sheath.
1.2.8.3 Leaf width, length, and thickness
Fully expanded leaf blade number five was identified (n=7). Its middle section’s (widest) width and length were measured using a ruler. The thickness of the left and right sides (blade’s wing) was also measured using a thickness gauge micrometre (QST, China).
1.2.8.4 Dry matter
At 24 DAS (vegetative stage), the whole plants were then separated into shoot and root, then the dry weight of each part was determined after 48 hours of drying at 60°C in a drying oven (n=7). Total dry weight was taken using an electronic weighing scale (AND, GH-202).
1.2.8.5 Relative chlorophyll content
Chlorophyll concentration was quantified using a chlorophyll meter SPAD-502 Plus (KONICA MINOLTA OPTIC, Japan) (n=9). The middle section of the leaf blade was always used for this purpose.
1.2.9 Stomatal properties
1.2.9.1 Leaf surface impressions
Leaf surface impressions were taken using the vinyl polysiloxane dental impression resin (ImpressPLUS Wash, Perfection Plus Ltd, UK) (Figure 3.6A). Impressions were taken against the abaxial side of the leaf blade’s middle section. The two components of the silicon-based resin were mixed in a petri dish and then immediately applied smoothly onto the leaf surface (Figure 3.6B-D). This mixture was allowed to dry completely, approximately 10-15 minutes at room temperature before removal (Figure 3.6E). The procedure was performed around 9.00 am to 12.00 pm to avoid stomata closure.
The negative imprint of the epidermal impression was then layered with clear nail polish (Barry M Cosmetics Ltd, UK) (Figure 3.6F). Subsequently, the dried nail varnish layer was peeled off to serve as a positive reproduction of the original leaf surface. This translucent layer was placed onto a glass slide and observed under a light microscope at 400x magnification (BX51, OLYMPUS, Japan) (Figure 3.6G). Photomicrographs of the leaf surface were taken using Olympus camera DP26 (5 megapixels) using an Olympus U-TVO. 5X camera adapter attached to the microscope. All images were processed using cellSens Standard Version 1.12. The measurements of a stomatal complex and its components (Figure 3.6) were made by tracing their outline on the images using ImageJ (Version 1.52p) software.


Figure 3.6 : Leaf surface impression method procedure. A: vinyl polysiloxane dental impression resin; B: The two components of the silicon-based resin; C: Mixed the solution; D: Applied smoothly onto the abaxial leaf surface; E: Removal of the imprint; F: layered with clear nail polish; G: BX51, OLYMPUS light microscope
1.2.9.2 Measurement of stomatal properties
Interveinal gap (IG) approximately midway between the midrib and leaf margin (middle IG) width-wise was used as the sampled area for stomatal distribution and size measurements. This protocol was based mainly on Yaapar's (2017) work which reported leaf regions that accounted for the minimum variation in stomatal count and dimension parametres. Figure 3.7 shows the typical structure of a stomatal complex in rice and the associated dimensional components. These components are described as follows:
i. Stomatal Complex Area (SCA): Measured by drawing their outline on the images using the freehand selection tool in ImageJ.
ii. Stomatal Complex Length (SCL) and Width (SCW): Measured by using the straight-line selection tool in ImageJ.
iii. Stomatal Pore Aperture Length (AL) and Width (AW): Measured by using the straight-line selection tool in ImageJ.
iv. Stomatal Pore Area (SPA): Data measured from AL and AW were used in an equation developed by Yaapar (2017) to calculate SPA.

v. Stomatal Density (SD): The number of stomatal complexes of the abaxial leaf surface was counted from two sides of interveinal gap areas demarcated by two small veins (see the dotted white line in Figure 3.8).

Figure 3.7 : A typical structure of a stomatal complex in rice. Stomatal Complex Area (SCA), Stomatal Complex Length (SCL) and Width (SCW), and Stomatal Pore Area (SPA). Scale bar = 5µm. Adapted from Yaapar (2017)

Figure 3.8 : A typical epidermal features and stomatal patterning in a rice leaf. The stomata density and leaf epidermal properties are quantified partially from two IGs areas which are divided by a small vein (dotted white line) in the middle. Each measuring resolution comprises several cell files that are pure epidermal files or contain at least one stomatal complex termed stomatal file. Scale bar = 40 µm
1.2.10 Biochemical and physiological analysis
1.2.10.1 Gas exchange measurement and chlorophyll fluorescence
Measurements of carbon dioxide assimilation rates were made using a portable Infra-Red Gas Analyzer (IRGA) photosynthesis system (LI-6800 from LI-COR Bioscience, USA) (Figure 3.9). Irradiance was provided by an LED RGB (Red Green Blue) light source (Multiphase Flash™ Fluorometer 6800-01A, LI-COR Bioscience, USA). The irradiance was 10% blue light (to promote stomatal opening and avoid stomatal closure) with 90% red light. The block temperature within the chamber was maintained at 27°C with ambient humidity (~ 60% relative humidity). The flow setpoint was set at 500 μmol s-1, valve 0.1 kPa with a fan speed setting of 10,000 rpm. CO2 was provided by 8-gram CO2 cartridge sets (Mosa® soda chargers, Taiwan).

Figure 3.9 : Portable Infra-Red Gas Analyzer (IRGA) photosynthesis system (LI-6800 from LI-COR Bioscience, USA)
In this experiment, rice leaf five (L5) were randomly selected, and measurements were made on the widest middle portion of the fully expanded leaf blade. Leaf number 5 is typically selected because it is the youngest fully expanded leaf at the time of measurement and is considered to be a representative leaf in terms of its physiological activity. In rice, leaf development occurs in a sequential manner, with the youngest leaves being the most physiologically active. Leaf number 5 is usually selected for gas exchange measurement because it is fully expanded and has reached a stage of physiological maturity where photosynthesis is stable and can be reliably measured. Additionally, leaf 5 is usually located near the top of the plant, which allows for easy access and measurement using gas exchange equipment. Furthermore, leaf number 5 is the most commonly used leaf for gas exchange measurements in rice research, and this convention has been followed to ensure that data are comparable across different studies. Using the same leaf number for measurements is important for standardization and consistency of data, as it reduces potential sources of variation that could arise from using different leaves for measurements.
The width of the leaf was measured and manually inserted into the machine for every leaf measurement. Stomatal ratio ‘K’ was set to be 1.0. Measurements were made one hour after the light came on in the growth chamber from 9.00 am to 12.00 pm. The IRGA was regularly matched to eliminate any difference between the Reference and Sample CO2 and H2O of IRGA readings. The clamped leaf was first allowed to acclimatise at a steady state using the settings above at an irradiance of 2000 μmol m-2 s-1. 2000 μmol m-2 s-1 is a saturation level for rice plant based on previous light response curve measurement. This step lasted at least 15 minutes, or until the assimilation rate and stomatal conductance, readings became stable before measurements were started or logged.
1.2.10.2 Light response curve and chlorophyll fluorescence
Light response curves (assimilation versus PAR) were performed with CO2 levels inside the cuvette set to 400 ppm, while the irradiance was progressively decreased from 2500 μmol m-2 s-1 to 0 μmol m-2 s-1 irradiance (Table 3.1). Leaves were exposed to each irradiance level for a minimum period of 120 seconds and a maximum of 180 seconds to allow photosynthetic rates to stabilise. The fluorescent measurement function is activated during the light curve procedure. Figure 3.10 shows the dark-adapted and light-adapted in performing leaf chlorophyll fluorescence measurement using the saturation pulse method with quenching analysis principle for various quantum efficiencies of photosystem II. From this procedure, five primary fluorescence kinetics (Fm, Fo, Fm’, Fs’, Fo’ in Table 3.2) parameters were obtained.
Table 3.1 : Range and order of irradiance used in the determination of light responses curve
Number setting | Qin (μmol m-2s-1) |
1 | 2500 |
2 | 2000 |
3 | 1800 |
4 | 1600 |
5 | 1400 |
6 | 1200 |
7 | 1000 |
8 | 800 |
9 | 600 |
10 | 400 |
11 | 200 |
12 | 100 |
13 | 50 |
14 | 0 |

Figure 3.10 : Dark-adapted and light-adapted leaf fluorescence measurement principle using the saturation pulse method with quenching analysis. ML: measuring light, SP: saturation pulse, AL: actinic light, FR: far-red light. (Brestic & Zivcak, 2013; Kalaji, Goltsev, ., et al., 2017; Murchie & Lawson, 2013)
Table 3.2 : Basic parameters derived from fluorescence kinetics
Parameter | Physiological interpretation | Derivation (if any) | Eq. |
F, F' | Fluorescence emission from dark- or light-adapted leaf |
|
|
Fo | Minimal fluorescence from dark-adapted leaf (PS II centres open) | Fo'=Fo/((Fv/Fm)+(Fo/Fm') ) |
|
Fo' | Minimal fluorescence from light-adapted leaf (PS II centres open) | 3.2 | |
Fm, Fm' | Maximum fluorescence from dark- or light-adapted leaf (PS II centres closed) |
|
|
Fs' | Steady-state fluorescence at any light level |
|
|
Fv | Variable fluorescence from dark-adapted leaf | Fv=Fm-Fo | 3.3 |
Fq' (=∆F') | Photochemical quenching of fluorescence by open PS II reaction centre | Fq'=Fm'-Fs' | 3.4 |
Fv' | Variable fluorescence from light-adapted leaf | Fv'=Fm'-Fo' | 3.5 |
ΔF/Fm′ or Fq’/Fm' or ΦPSII | PSII operating efficiency: the quantum efficiency of PSII electron transport in the light | (Fq')/(Fm' )=(Fm'-F')/(Fm' )
| 3.6 |
ETR | Electron transport rate
| ETR= ΦPSII × PPFD × β × α
β = 0.5 (PSII/PSI constant) α = 0.84 (leaf absorbance)
| 3.7 |
ΦCO2 | Quantum yield of the carboxylation rate | ΦCO2=(A-Ao)/(PPFD x α) A = Assimilation rate Ao= Dark assimilation rate α = 0.84 (leaf absorbance) | 3.8 |
The light response curves were then analyzed using Photosynthetic Light Response Curve Fitting software (version 1.0) from Landflux.org. The following parameters were measured or derived from the light response curve (A-PAR curve):
i. The apparent quantum yield of photosynthesis: Initial slope of the assimilation rate
ii. Maximum net assimilation rate (Amax): Amax is the maximum rate of photosynthesis at saturating light and CO2 levels from light curve.
iii. Stomatal conductance (gs), intercellular CO2 (Ci)
iv. Intrinsic Water Use Efficiency (iWUE) calculated by dividing assimilation rate to stomatal conductance (A/gs)
v. CO2 assimilation rate (A) – light response curve
vi. Stomatal conductance (gs) – light response curve
vii. Intrinsic Water Use Efficiency (iWUE) – light response curve
viii. Quantum yield of PSII electron transport (ΦPSII) – light response curve. ΦPSII is the efficiency of PSII photochemistry and is estimated by measuring the chlorophyll fluorescence emission as also mention in Table 3.2
ix. Electron transport rate (ETR) – light response curve is estimated by measuring the chlorophyll fluorescence emission as also mention in Table 3.2
x. Quantum yield of CO2 assimilation (ΦCO2) – light response curve is estimated by measuring the chlorophyll fluorescence emission as also mention in Table 3.2
xi. The ratio between ΦPSII and ΦCO2 approximates a plant's efficiency of using absorbed photons to assimilate CO2.
1.2.10.3 Carbon dioxide response curve
For CO2 response curves (A/Ci curve), the cuvette condition was set similarly to section 3.2.10.1 with saturating irradiance 2000 μmol m-2 s-1 and the atmospheric CO2 concentrations reference (CO2_R) outlined in Table 3.3. In addition, the minimum wait time after each CO2 concentration change before logging was set to180 seconds and the maximum time of 240 seconds. Finally, due to extensive CO2 concentration changes throughout, auto-match was utilised to sync chambers reading between the reference and sample every time a new CO2 was concentration given.
Table 3.3 : Range and order of CO2 reference used in the determination of CO2 responses curve
Number setting | CO2_R (μmol m-2 s-1) |
1 | 400 |
2 | 300 |
3 | 200 |
4 | 100 |
5 | 50 |
6 | 400 |
7 | 500 |
8 | 600 |
9 | 800 |
10 | 1000 |
11 | 1200 |
12 | 1400 |
13 | 1600 |
14 | 1800 |
15 | 400 |
Values of A and Ci were entered into the A-Ci Curve Fitting software version 10.0 (downloaded at Landflux.org) written in Microsoft Excel using the macros function by Ethier & Livingston (2004). The tool generated curve fitting for the data points and parameter estimates based on infinite and optimized mesophyll conductance. Parameters were measured or derived from the carbon dioxide response curve:
i. CO2 assimilation rate (A) vs Intercellular CO2 (Ci) curve
ii. Vcmax: maximum Rubisco carboxylation rate
iii. Jmax: maximum light- and CO2-saturated electron transport rate
1.2.11 Experimental design
The treatments comprising two CO2 concentration levels and two rice varieties were arranged in nested design with 15 replications; with three plants per replication. The rice varieties were nested within the CO2 treatment. This is due to constraints in the study setup and the availability of facilities for the experiment.
1.2.12 Data analysis
The data obtained were analysed and visualised using a two-sample t-test to compare the means between eCO2 and aCO2 seedlings for each variety using Microsoft 365 Excel® and GraphPad Prism Version 8.
1.3 Results
1.3.1 Seedling vegetative growth
CO2 enrichment (~800ppm, Appendix 1) resulted in a more tillers number and taller plant appearance for MR219 and MR263 after 24 days of treatment (Figure 3.11), where the bushy effect was more pronounced in MR263 than MR219 visually. The measured seedling height of elevated CO2 treatment (eCO2) for both varieties had significantly higher (P<0.001) mean values of 53.3 cm for MR219 (about 42% increase) and 50.19 cm for MR263 (about 38% increase) compared to the ambient grown seedlings (Table 3.4, aCO2). This magnitude of increase was summarised in Figure 3.12.

Figure 3.11 : Ambient and elevated CO2 Rice seedlings at 24DAS for MR219 (A) and MR263 (B). Scale bar equals 8 cm
By 24DAS, eCO2 seedlings had about seven leaves, which was consistent for both varieties, while ambient seedlings had only about five leaves (Table 3.4). Interestingly, aCO2 seedlings partitioned more of their biomasses into making shoot organs than roots. Again, this trend was true for both varieties, but CO2 enriched MR219 invested about 36% less shoot than the ambient compared to only 12% less shoot in MR263. The high CO2 condition consistently triggered massive root biomass leading to a high shoot/root ratio in the ambient grown seedlings (summarised in Figure 3.12)
Table 3.4 : Effects of aCO2 and eCO2 on rice seedling vegetative growth at day 24DAS
| MR 219 | MR 263 | ||||
Ambient | Elevated | T-Test | Ambient | Elevated | T-Test | |
Seedling height (cm) | 37.67±0.88 | ↑53.33±1.40 | *** | 36.76±0.70 | ↑50.19±1.50 | *** |
Leaf number | 5.6±0.1 | ↑7.3±0.1 | *** | 5.3±0.1 | ↑6.7±0.2 | *** |
Shoot dry weight (g) | 0.25±0.02 | ↑0.36±0.03 | * | 0.20±0.01 | ↑0.33±0.03 | ** |
Root dry weight (g) | 0.05±0.01 | ↑0.13±0.01 | *** | 0.06±0.01 | ↑0.12±0.01 | *** |
Shoot/root ratio | ↑4.7±0.3 | 3.0±0.3 | ** | 3.3±0.1 | 2.9±0.2 | ns |
Total dry weight (g) | 0.31±0.02 | ↑0.49±0.03 | ** | 0.26±0.02 | ↑0.44±0.03 | *** |
Two samples t-tests were performed to compare means with significant differences between comparisons indicated in asterisks *** (significant at p<0.001), ** (significant at p<0.01), *(significant at p<0.05), and ns (not significant) using n=7 for all parametres. The upward arrow ↑signifies the increase when compared to the opposite CO2 environment between a similar variety. Detailed T-test analysis is presented in Appendix 1.
1.3.2 Leaf properties
The rice leaf blades measured in this study were linearly asymmetrical, with the widest part in the middle. Moreover, even the middle region of the blade was uneven in terms of thickness, thus confirming a similar finding by You-ding et al. (2007). There were significant (p<0.01) differences in both MR219 leaf middle part thickness at the thick (about 0.11 mm) and thin (about 0.8 mm) side for eCO2 seedlings (Table 3.5, detailed in Appendix 2). A similar thin-thick side thickness trend was also measured in MR263 (Table 3.5). Treatment with elevated CO2 resulted in rice leaf thickness increase between 33-38% for MR219 and 22-33% for MR263 (Figure 3.12). In addition, there were also notable differences in rice leaf width and length with the eCO2 treatments for both varieties, where eCO2 blades were broader (MR219 was about 0.49 mm while MR263 was about 0.44 mm) and longer (MR219 was about 32.86±1.10 mm while MR263 was about 27.71±0.42 mm) than aCO2 leaves (Table 3.5).
Table 3.5 : Effect of aCO2 and eCO2 on rice leaf properties (leaf number five) at 24 DAS
| MR 219 | MR 263 | ||||
Ambient | Elevated | T-Test | Ambient | Elevated | T-Test | |
Middle section blade thickness (thick side) (mm) | 0.08±0.00 | ↑ 0.11±0.01 | ** | 0.09±0.01 | ↑0.11±0.00 | *** |
Middle section blade thickness (thin side) (mm) | 0.06±0.004 | ↑ 0.08±0.006 | ** | 0.06±0.002 | ↑0.08±0.003 | *** |
Leaf number 5 width (mm) | 0.44±0.02 | 0.49±0.03 | ns | 0.43±0.03 | 0.44±0.02 | ns |
Leaf number 5 length (mm) | 24.86±1.06 | ↑ 32.86±1.10 | *** | 25.71±0.71 | ↑27.71±0.42 | * |
Two samples t-tests were performed to compare means with significant differences between comparisons indicated in asterisks *** (significant at p<0.001), ** (significant at p<0.01), *(significant at p<0.05), and ns (not significant) using n=7 for all parametres. The upward arrow ↑signifies the increase when compared to the opposite CO2 environment between

Figure 3.12 : Horizontal bar charts as a summary for percentage changes in seedling vegetative growth and leaf properties of MR219 (red bars) and MR263 (blue bars) in response to eCO2 against aCO2 treatment
1.3.3 Stomatal properties
eCO2 treatment resulted in a larger overall stomatal complexes area (SCA) for both MR219 (Figure 3.13A and B) and MR263 varieties (Figure 3.13C and D) However, the SCA of MR219 eCO2 (266.61±11.59 µm2) had an increase of by only 14% (Figure 3.14A) while MR263 eCO2 (294.48±10.29 µm2) considerably increased by 45.7% (Figure 3.14B). This in general was also the trend for length (SCL) and width (SCW) dimension measurements of the stomatal complexes. The eCO2 had a longer SCL (26.41±0.58 µm, Figure 3.14C) by 13.2% but slightly narrower SCW (13.81±0.57 µm, Figure 3.14E) by -0.4% for the MR219 variety. eCO2 treatment also showed an increase in SCL (29.04±0.97 µm, Figure 3.14D) and SCW (15.61±0.36 µm, Figure 3.14F) for MR263 variety by 25.8% and 20.6%, respectively compared to the aCO2 leaves.

Figure 3.13 : Representative stomatal complexes images of (A) MR219 grown in ambient CO2 while (B) grown in elevated CO2. (C) MR263 grown in ambient CO2 and (D) when grown in elevated CO2 conditions. Scale bar equals 40 μm. Asterisks indicate stomatal complexes among epidermal files

Figure 3.14 : Dimensional measurements of stomatal complex area (A-B), length (C-D), and width (E-F) in fully expanded leaf no. five of MR219 and MR263 grown in ambient (blue data points, aCO2) and elevated CO2 (red data points, eCO2) conditions. Vertical error bars represent the standard error of means while long horizontal lines are the means. Student's T-test was performed for mean comparison with significant levels indicated as asterisks *** (significant at p<0.001), ** (significant at p<0.01), *(significant at p<0.05), and ns (not significant) using n=9 for all parametres. Detailed T-test analysis is presented in Appendix 3
It is critical to assess the pore area to estimate stomatal performance since the aperture (pore) area is a likely feature that controls the amount of CO2 that enters the leaf. The approximation of the stomatal pore area (SPA) was determined based on the methods and equations described in section 3.2.9.2 developed by (Yaapar, 2017). It was clear that the eCO2 treatment resulted in a significant increase in SPA (Figure 3.15A and B), longer stomatal pore aperture length (SPAL, Figure 3.15C and D) and wider stomatal pore aperture width (SPAW, Figure 3.15E and F) for both varieties. The mean values of eCO2 MR219 SPA (81.88±5.12 µm2), SPAL (18.10±0.44 µm) and SPAW (5.87±0.53 µm) increased by 62%, 21.9%, and 5.4%, respectively compared to the aCO2. MR263 under eCO2 also resulted in a significant increase of SPA (101.97±3.47 µm2), SPAL (18.91±0.38 µm) and SPAW (6.54±0.19 µm) by 64.4%, 34.7%, and 20.4%, respectively than the control.
The frequency of stomata in MR219 was quantified using stomata density (SD) but did not yield a significant difference between eCO2 and aCO2 (Figure 3.16A). There was a tendency for aCO2 to have a 10.18% higher density (347±10 stomata mm-2) than eCO2 on average. A similar finding but with notable significance was quantified in MR263 leaves in which eCO2 distribution (323±18 stomata mm2) decreased by 19.2% compared to the ambient CO2 grown leaves (Figure 3.16B). Figure 3.17 summarised the comparison finding pertaining to the stomatal properties for MR219 and MR263 grown in the eCO2 and aCO2 environments.

Figure 3.15 : Measurements of stomatal pore area (A-B), stomatal pore aperture length (C-D) and width (E-F) in fully expanded leaf no. five of MR219 and MR263 grown in ambient (blue data points, aCO2) and elevated CO2 (red data points, eCO2) condition. Vertical error bars represent the standard error of means while long horizontal lines are the means. Student's T-test was performed for mean comparison with significant levels indicated as asterisks *** (significant at p<0.001), ** (significant at p<0.01), and ns (not significant) using n=9 for all parametres. Detailed T-test analysis is presented in Appendix 4

Figure 3.16 : Measurements of stomatal density (A-B) in fully expanded leaf no. five of MR219 and MR263 grown in ambient (blue data points, aCO2) and elevated CO2 (red data points, eCO2) conditions. Vertical error bars represent the standard error of means while long horizontal lines are the means. Student's T-test was performed for mean comparison with significant levels indicated as asterisks ** (significant at p<0.01), and ns (not significant) using n=9 for all parametres. Detailed T-test analysis is presented in Appendix 5

Figure 3.17 : Horizontal bar charts as a summary of percentage changes in stomatal size and frequency properties of MR219 (red bars) and MR263 (blue bars) in response to eCO2 against aCO2 treatment. SCA, stomatal complex area; SCW, stomatal complex width; SCL, stomatal complex length; SPA, stomatal pore area; SPAW, stomatal pore aperture width; SPAL, stomatal pore aperture length; SD, stomatal density
1.3.4 The aCO2 and aCO2 rice leaves response to irradiance
1.3.4.1 Assimilation vs. light response curves
Light versus assimilation rate response curves was performed on 24 DAS to study the extent to which aCO2 and eCO2 treatments affected carbon assimilation, light saturation rates and apparent quantum yield value. The progressive increase of irradiance levels (PPFD) resulted in a rapid initial increase of assimilation (A) before plateauing thus creating a biphasic curve (Figure 3.18). Leaves grown in either aCO2 or eCO2 for MR219 and MR263 had a saturated A rate under the irradiance of 2000 μmol m-2 s-1. The maximum rate of photosynthesis was 33.23% higher in eCO2 MR219 grown leaves (21.77 ± 3.05 μmol m-2 s-1) compared to aCO2 MR219 leaves (16.34 ± 2.46 μmol m-2 s-1) Figure 3.18A). For eCO2 MR263 (21.41 ± 2.01 μmol m-2 s-1), the saturate rate of A was 17.77% higher compared to aCO2 MR219 (18.18 ± 2.38 μmol m-2 s-1). The general boost of A was more prominent in MR219 leaves than in MR263 CO2 enriched seedlings. Hence based on this finding, the light value in the measuring chamber was consistently set to 2000 μmol photon m-2 s-1 for all subsequent A-Ci response curve studies. While analysing A-Ci response curves, this was crucial to eliminate photosynthetic limitation caused by the insufficient light amount and to activate Rubisco.


Figure 3.18 : Assimilation (A) versus varying photosynthetic photon flux density (PPFD) response curves (A-B) in fully expanded rice leaf no. five of MR219 and MR263 grown in elevated CO2 (red data points, eCO2) or ambient CO2 (blue data points, aCO2). Vertical error bars represent the standard error of the means. Student's T-test was performed for mean comparison with significant levels indicated as asterisks *** (significant at p<0.001), ** (significant at p<0.01), *(significant at p<0.05), and ns (not significant) using n=6 for all parametres. Detailed T-test analysis is presented in Appendix 6
The maximum rate of assimilation (Amax) means values for eCO2 rice are 23.40 μmol CO2 m-2 s-1 (MR219) and 23.09 μmol CO2 m-2 s-1 (MR263) while ambient is 17.43 μmol CO2 m-2 s-1 (MR219) and 19.90 μmol CO2 m-2 s-1 (MR263). The Amax was significantly higher with a 34.8% increase for MR219 (P<0.001) and 16.3% for MR263 (P<0.05) (Figure 3.19 A-B and summarised in Figure 3.30). The total chlorophyll content for eCO2 treatment increased by 3% for MR263 (aCO2: 30.1±1.0 and eCO2: 30.8±1.0) and 5% for MR219 (aCO2: 26.2±0.9 and eCO2: 27.6±0.8) (Figure 3.30), respectively but these were not statistically significant (Figure 3.19C-D).

Figure 3.19 : The maximum assimilation rate (A-B), relative chlorophyll content (SPAD value) (C-D) in fully expanded rice leaf no. five of MR219 and MR263 grown in ambient (blue data points, aCO2) and elevated CO2 (red data points, eCO2) conditions. Vertical error bars represent the standard error of means while long horizontal lines are the means. Student's T-test was performed for mean comparison with significant levels indicated as asterisks *** (significant at p<0.001), ** (significant at p<0.01), *(significant at p<0.05), and ns (not significant) using n=9 for all parametres. Detailed T-test analysis is presented in Appendix 7
1.3.4.2 Stomatal conductance-light response curves
A series of stomatal conductance (gs)-PPFD curves (Figure 3.19) were obtained from the six rice seedlings used in the previous subsection dealing with the assimilation-light response curves. Stomatal conductance describes the ability of the stomatal aperture to regulate gas exchanges into and out of the leaf (Tuzet, 2011). According to Gimenez et al. (2013), gs can be used as an indicator of a plant’s water status and degree of stomatal opening. Feedback processes link gs to leaf water potential. Reduced gs prevent additional reductions in water potential by reducing transpiration; likewise, water potential reductions might cause stomatal closure, resulting in lowered gs.
From Figure 3.20, the increases of gs were observed when PPFD was increased from 0 to 2000 μmol photon m-2 s-1 for both varieties and treatments. There were no significant differences in gs between aCO2 and eCO2 treatments for MR219 at PPFD of 0 to 800 μmol photon m-2 s-1 (Figure 3.20A). As for MR263, under low PPFD of 0 to 100 μmol photon m-2 s-1, there were no significant differences in gs among different treatments (Figure 3.20B). However, gs was significantly lower at each of the varieties for eCO2 seedlings compared with that of plants grown in ambient at higher PPFD. For example, eCO2 MR219 at PPFD of 1000-2500 μmol photon m-2 s-1 and eCO2 MR263 at 200-2500 μmol photon m-2 s-1, the gs values were significantly lower than ambient at P<0.05 (Figure 3.20 and Appendix 8).
The eCO2 leaves had a significantly lower maximum stomatal conductance (gsmax) (eCO2 MR219; 0.48 mol H₂O m-2 s-1 and eCO2 MR263; 0.44 mol H₂O m-2 s-1 ) than aCO2 leaves (aCO2 MR219; 0.37 mol H₂O m-2 s-1 and aCO2 MR263; 0.31 mol H₂O m-2 s-1) suggesting that they were transpiring at a slower rate than ambient leaves (Figure 3.20A-B). This is consistent with a higher intrinsic water use efficiency (iWUE)-PPFD curves (in Figure 3.21A-B) in eCO2 plants compared to ambient plants. The mean value of maximum stomatal conductance (gsmax) also shows a reduction of gs for eCO2 seedlings by -28.06% (MR219; 0.37 mol H₂O m-2 s-1) and -27.93% (MR263; 0.31 mol H₂O m-2 s-1) compared to aCO2.


Figure 3.20 : Response curves of stomatal conductance (gs) against photosynthetic photon flux density (PPFD) (A-B) in fully expanded leaf no. five of MR219 and MR263 grown in elevated CO2 (red data points, eCO2) and ambient CO2 (blue data points, aCO2). Vertical error bars represent the standard error of means. Student's T-test was performed for mean comparison with significant levels indicated as asterisks *(significant at p<0.05), and ns (not significant) using n=6 for all parametres. Detailed T-test analysis is presented in Appendix 8
1.3.4.3 Intrinsic water use efficiency-light response curves
Intrinsic water use efficiency (iWUE) is most typically calculated by measuring leaf gas exchange using a portable photosynthetic device that allows simultaneous monitoring of carbon and water fluxes at the leaf level (Medrano et al., 2015). The iWUE is estimated by the ratio value of CO2 assimilation (A) and stomatal conductance (gs) (Broeckx et al., 2014). Besides that, it can also be estimated using other methods such as stable isotope discrimination and eddy covariance fluxes (Medlyn et al., 2017). The iWUE response is connected to physiological mechanisms that manage CO2 and water gradients between the leaf and the air surrounding it. The iWUE is believed to be more realistic and comparable across research than WUE (assimilation (A) over transpiration (E)) because it is not influenced by variations in leaf to air VPD in the leaf chamber of the IRGA (Bacon, 2004).
At low PPFD, the iWUE of both varieties and treatments increased almost linearly with the increasing irradiance intensity (Figure 3.21A-B). The iWUE increased until reaching the saturation irradiance point (1000 μmol photon m-2 s-1) and maintained until 2500 μmol photon m-2 s-1. From Figure 3.21A-B, eCO2 rice seedlings showed significantly higher iWUE than aCO2 starting at 400 μmol photon m-2 s-1 to 2500 μmol photon m-2 s-1. The two treatments showed no significant difference at low PPFD points (200 μmol photon m-2 s-1 and below). The maximum iWUE for both MR219 (62.63±8.87 μmol CO2 mol H2O-1) and MR263 (62.73±2.78 μmol CO2 mol H2O-1) was observed at 2500 μmol photon m-2 s-1. The eCO2 has increased the mean value of iWUEmax of MR219 by 68% and MR263 by 38.4% compared to ambient.


Figure 3.21 : Response curves of intrinsic water use efficiency (iWUE) to varying photosynthetic photon flux density (PPFD) (A-B) in fully expanded leaf no. five of MR219 and MR263 grown in elevated CO2 (red data points, eCO2) and ambient CO2 (blue data points, aCO2). Vertical error bars represent the standard error of means. Student's T-test was performed for mean comparison with significant levels indicated as asterisks *** (significant at p<0.001), ** (significant at p<0.01), * (significant at p<0.05), and ns (not significant) using n=6 for all parametres. Detailed T-test analysis is presented in Appendix 9
1.3.4.4 Quantum yield of Photosystem II-light response curves
In plants, the reaction centre for converting light energy to organic molecules is known as Photosystem II (PSII). At PSII, photosynthesis-related activities take place which includes the splitting of water molecules to supply electrons and the dissipation of chlorophyll fluorescence (Lambers & Oliveira, 2019). Abiotic and biotic stress has an impact on PSII and electron transport (Kalaji et al., 2016). The quantum yield of PSII (ΦPSII) can be interpreted as the estimated effective quantum yield or operating efficiency of PSII photochemistry at a given PAR (Murchie & Lawson, 2013; Kalaji et al., 2017). This parameter gives the proportion of absorbed light utilised in PSII photochemistry and can be used to estimate the electron transport rate via PSII (Murchie & Lawson, 2013).

Figure 3.22 shows the quantum yield of PSII (ΦPSII)-PPFD curves of aCO2 and eCO2 in rice plants. The ΦPSII-PPFD curves of MR219 and MR263 in both treatments are inverse proportional functions. The values of ΦPSII for both varieties and treatments decreased with the increasing PPFD levels. Rice seedlings with eCO2 for both varieties (MR219 and MR263) displayed significant different alterations in the quantum yield of photosystem II (ΦPSII) compared with aCO2 seedlings. T-test showed that MR219 and MR263 treatment with eCO2 displayed a significantly higher ΦPSII almost at all PPFD levels examined at P<0.05 and P<0.01 respectively than ambient (Figure 3.22) except at low PPFD (50 and 100 μmol photon m-2 s-1) of MR263. At the highest PPFD (2500 μmol photon m-2 s-1) level, the eCO2 plants of both MR219 (ΦPSII: 0.095) and MR263 (ΦPSII: 0.093) have 29% higher ΦPSII than aCO2.
Figure 3.22 : Response curves of quantum yield of photosystem II (ΦPSII) to varying photosynthetic photon flux density (PPFD) (A-B) in fully expanded leaf no. five of MR219 and MR263 grown in elevated CO2 (red data points, eCO2) and ambient CO2 (blue data points, aCO2). Vertical error bars represent the standard error of means. Student's T-test was performed for mean comparison with significant levels indicated as asterisks *** (significant at p<0.001), ** (significant at p<0.01), *(significant at p<0.05), and ns (not significant) using n=6 for all parametres. Detailed T-test analysis is presented in Appendix 10
1.3.4.5 Electron transfer rate-light response curves
Photochemical electron transport rate (ETR) is determined from chlorophyll-fluorescence parameters from the gas exchange (μmol electron m-2 s-1) (Haworth et al., 2018). Estimated ETR in MR219 and MR263 rice seedlings under aCO2 and eCO2 conditions for different irradiance intensities are presented in Figure 3.23. Rice seedlings exposed to eCO2 for both varieties displayed a significantly higher ETR almost at all PPFD levels. This was expected as Figure 3.22 showed before that ΦPSII was reduced in ambient CO2 rice plants compared to elevated CO2 rice plants. In MR219, the ambient seedlings ETR increased until reaching saturating light intensity level at 1000 μmol photon m-2 s-1 point and the saturating irradiance for eCO2 MR219 is at 1200 μmol photon m-2 s-1. While for MR263, the ambient seedlings ETR increased until reaching 1200 μmol photon m-2 s-1 point and 1400 μmol photon m-2 s-1 for eCO2 seedlings. Further increase of light irradiance causes a decrease in ETR. Based on Figure 3.23 and Appendix 10, the mean value of MR219 maximum electron transfer rate (ETRmax) estimated for aCO2 is 86.4 μmol electron m-2 s-1 and eCO2 is 114.3 μmol electron m-2 s-1. The mean of ETRmax for aCO2 MR263 is 96 μmol electron m-2 s-1 and 111.1 μmol electron m-2 s-1 for eCO2 MR263 seedlings. The mean value of ETRmax for eCO2 MR219 and MR263 increased 32% and 15.8% than aCO2.


Figure 3.23 : Response curves of electron transport rate (ETR) to varying photosynthetic photon flux density (PPFD) (A-B) in fully expanded leaf no. five of MR219 and MR263 grown in elevated CO2 (red data points, eCO2) and ambient CO2 (blue data points, aCO2). Vertical error bars represent the standard error of means. Student's T-test was performed for mean comparison with significant levels indicated as asterisks *** (significant at p<0.001), ** (significant at p<0.01), * (significant at p<0.05), and ns (not significant) using n=6 for all parametres. Detailed T-test analysis is presented in Appendix 11
1.3.4.6 Quantum yield of CO2 assimilation-light response curves
CO2 fixation quantum efficiency (ΦCO2) is calculated by dividing the rate of CO2 assimilation (adjusted for respiratory losses) by the rate at which quanta is absorbed using gas exchange as mentioned in the method section, 3.2.10.
Based on Figure 3.24, the quantum yield of CO2 assimilation (ФCO2) exponentially decreased with the increasing irradiance same as the ФPSII-PPFD curves at 3.3.4.4. The ΦCO2-PPFD curves of MR219 and MR263 were all showing a sharp downward trend between 50 and 200 μmol photon m-2 s-1 and a slow downward trend between 400 and 2500 μmol photon m-2 s-1. The ФCO2 of eCO2 MR219 was almost similar with no significant differences to that of the ambient at all PPFD levels (Figure 3.24A). However, ФCO2 of eCO2 MR263 was significantly higher at P<0.05 (Figure 3.24B) when measured from 800 to 2500 μmol photon m-2 s-1. At the highest irradiance level (2500 μmol photon m-2 s-1), the mean value of ФCO2 of ΦCO2Imax for eCO2 MR219 (0.0135) and MR263 (0.0123) is 55.94% and 41.74% higher than ambient.

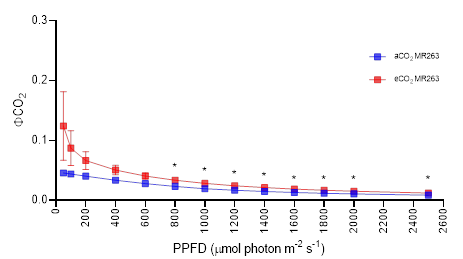
Figure 3.24 : Response curves of quantum yield of CO2 assimilation (ФCO2) to varying photosynthetic photon flux density (PPFD) (A-B) in fully expanded leaf no. five of MR219 and MR263 grown in elevated CO2 (red data points, eCO2) and ambient CO2 (blue data points, aCO2). Vertical error bars represent the standard error of means. Student's T-test was performed for mean comparison with significant levels indicated as asterisks *(significant at p<0.05), and ns (not significant) using n=6 for all parametres. Detailed T-test analysis is presented in Appendix 12
1.3.4.7 Relationship between quantum yields of photosystem II (ΦPSII) and CO2 fixation (ΦCO2)
According to Singh & Reddy (2015, 2018), the ΦPSII/ΦCO2 obtained from chlorophyll fluorescence and gas exchange measurements can be used as a photorespiration indicator. The slope approximates a plant's efficiency in using absorbed photons to assimilate CO2. As stated early, ΦCO2 is the ratio of gross CO2 assimilation to absorbed photons while ΦPSII is the proportion of absorbed light used to produce energy.
The relation between ФPSII and ФCO2 under aCO2 and eCO2 treatments showed significant positive correlations (Figure 3.25A and Figure 3.25B). There was a strong linear relationship between ΦPSII and ΦCO2 and the slope was about 24% (eCO2 MR219 slope value: 8.9929) and 31% (eCO2 MR263 slope value: 8.3399) lower under eCO2 than aCO2. The equation in Figure 3.25A shows the ratio of 8.99 photons per CO2 fixed for eCO2 MR219 (red dots) plants. The eCO2 MR219 (blue dots) plants show a ratio of 11.86 photons per CO2 assimilated (Figure 3.25A). Moreover, Figure 3.25B also shows the same trend as in Figure 3.25A. The equation for the eCO2 MR263 seedling (red dots in Fig 3.25B) shows that 8.34 photons were used to fix one molecule of CO2. While for ambient, 12.06 photons were used to fix a molecule of CO2. The occurrence or lack of photorespiration may be ascribed to the variation in the slope of the ФPSII and ФCO2 relationship, which represents the apparent electron demand to absorb one CO2 molecule ambient and eCO2. The eCO2 seedlings were relatively efficient at converting light energy into chemical energy.

Figure 3.25 : The ratio between ΦPSII and ΦCO2 of ambient and elevated CO2. (A) MR219 and (B) MR263 seedlings measured from light response curves (PPFD 50–2500 μmol m−2 s−1) in fully expanded leaves of rice number five grown in either ambient CO2 (blue data points) or elevated CO2 (red data points). The data points are the mean using n=9 vertical and horizontal error bars represent the standard error of means
1.3.5 The eLeaf and aLeaf response to CO2 concentration
1.3.5.1 Assimilation-carbon dioxide response curves
Gas exchange measurements were performed to assess the response of the aCO2 and eCO2 rice plants to different atmospheric CO2 concentrations, as indicated in Section 3.2.10.3. The CO2 assimilation-CO2 intercellular (A-Ci) response curves for aCO2 and eCO2 grown MR219 and MR263 seedlings are shown in Figure 3.26A-B and 3.27A-B respectively. At both ambient (400 ppm) and saturating (1600 ppm) CO2 concentrations, eCO2 MR219 and MR263 seedlings showed significantly higher CO2 assimilation rates than aCO2 (Figure 3.28). At 400 ppm CO2 concentration (Figure 3.28A), the eCO2 MR219 had an assimilation rate of 19.03±1.02 μmol CO2 m-2 s-1 which was 16.67% higher than that of aCO2 MR219 (16.31±0.65 μmol CO2 m-2 s-1). At the same CO2 concentration, eCO2 MR263 (Figure 3.29B) showed an assimilation rate of 20.81±0.57 μmol CO2 m-2 s-1. This also shows an increase in CO2 assimilation by 31.12% higher than aCO2 (15.87±1.28 μmol CO2 m-2 s-1). Both eCO2 MR219 (23.83±1.09 μmol CO2 m-2 s-1) and eCO2 MR263 (27.23±0.62 μmol CO2 m-2 s-1) showed a significant increase in maximum CO2 assimilation rates (Amax) of 16.66% and 32.03% respectively compared to aCO2 MR219 (20.43±0.48 μmol CO2 m-2 s-1) and aCO2 MR263 (20.62±0.55 μmol CO2 m-2 s-1) (Figure 3.28 C-D). This difference was due to eCO2 grown rice seedlings having significantly higher Vcmax (Figure 3.29 A-B) and Jmax (Figure 3.29 C-D) than aCO2 grown seedlings, indicating that eCO2 grown seedlings had more Rubisco for carboxylation. Vcmax and Jmax rates of eCO2 MR219 are (73.51±4.88 µmol CO2 m-2 s-1) 36.88% and (110.2±5.51 µmol e m-2 s-1) 20.8 % higher than aCO2. The eCO2 MR263 also showed an increase in Vcmax (71.58±2.76 µmol CO2 m-2 s-1)and Jmax (122.99±3.05 µmol e m-2 s-1) rates at 32.59% and 28.66% higher than ambient.

Figure 3.26 : Assimilation versus intercellular CO2 (A-Ci) (A-B) response curves for ambient CO2 and elevated CO2 of MR219. Measurements were carried out on attached, fully developed fifth leaves at 27 ◦C and at saturating irradiance of 2000 μmol m−2 s−1 PPFD. Data points are averaged from n=9 plants for each treatment. Ac (blue/red dashed lines) are CO2 assimilation rates limited by the amount and activity of Rubisco (enzyme limited/RuBP saturated). Aj (11blue/red solid lines) are CO2 assimilation rate limited by RuBP regeneration (light-limited/RuBP limited). Error bars show the standard error of the mean

Figure 3.27 : Assimilation versus intercellular CO2 (A-Ci) (A-B) response curves for ambient CO2 and elevated CO2 of MR263. Measurements were carried out on attached, fully developed fifth leaves at 27 ◦C and at saturating irradiance of 2000 μmol m−2 s−1 PPFD. Black-coloured data points are averaged from n=9 plants for each treatment. Ac (blue/red dashed lines) are CO2 assimilation rates limited by the amount and activity of Rubisco (enzyme limited/RuBP saturated). Aj (blue/red solid lines) are CO2 assimilation rate limited by RuBP regeneration (light-limited/RuBP limited). Error bars show the standard error of the mean

Figure 3.28 : Assimilation rate at 400 ppm CO2 (A-B), the maximum assimilation rate of (C-D) in fully expanded leaf no. five of MR219 and MR263 grown in ambient (blue data points, aCO2) and elevated CO2 (red data points, eCO2) conditions. Vertical error bars represent the standard error of means while long horizontal lines are the means. Student's T-test was performed for mean comparison with significant levels indicated as asterisks *** (significant at p<0.001), ** (significant at p<0.01), and *(significant at p<0.05) using n=9 for all parametres. Detailed T-test analysis is presented in Appendix 13

Figure 3.29 : Maximum Rubisco carboxylation rate (Vcmax) (A-B), the maximum light and CO2 saturated electron transport rate (Jmax) (C-D) in fully expanded leaf no. five of MR219 and MR263 grown in ambient (blue data points, aCO2) and elevated CO2 (red data points, eCO2) conditions. Vertical error bars represent the standard error of means while long horizontal lines are the means. Student's T-test was performed for mean comparison with significant levels indicated as asterisks *** (significant at p<0.001), ** (significant at p<0.01), and *(significant at p<0.05) using n=9 for all parametres. Detailed T-test analysis is presented in Appendix 14

Figure 3.30 : Horizontal bar charts as a summary for percentage changes in photosynthesis performance of MR219 (red bars) and MR263 (blue bars) in response to elevated CO2 against aCO2 treatment. The response ratio was calculated as a relative variation of each parameter under elevated CO2 treatment using the ambient CO2 as a control. Value bars facing the left and right indicate decreases and increases in properties compared to the value of ambient CO2 treatment, respectively. Amax, maximum net photosynthesis rate; gsmax, maximum stomatal conductance; iWUEmax, maximum intrinsic water use efficiency; ΦPSII2500, the maximum photochemical quantum yield of PSII at PPFD 2500 μmol photon m-2 s-1; ETRmax, maximum electron transport rate; ΦCO2,2500, the maximum quantum yield of CO2 assimilation at PPFD 2500 μmol photon m-2 s-1; Jmax, maximum light and CO2 saturated electron transport rate; Vcmax, maximum Rubisco carboxylation rate; A400, net assimilation rate at 400ppm CO2
1.3.6 Correlation Analysis
The relationships among various traits of pooled aCO2 and eCO2 seedlings for each variety were determined using Pearson’s correlation analysis (Fig X and Y). The 26 analysed traits were categorised into three main groups namely vegetative growth, stomatal and photosynthetic properties. The correlation analysis of MR219 seedling (Figure X) revealed that the biomass accumulation as in TDW, SDW and RDW had a significant (P<0.05) and strong negative correlation with the width dimension of stomata namely SCW (R=-0.68 and higher). Likewise, a similar negative correlation pattern was shown by gsmax (R= -0.65 to -0.79). However, the pattern was opposite where the mentioned biomass had a highly significant (P<0.01) and positive significant correlation with various photosynthetic parameters including iWUEmax (R>0.60), ΦPSIImax (R>0.73) and ETRmax (R>0.69).
On the other hand, Pearson’s correlation analysis for MR263 seedlings (Figure Y) variety had a significant, strong positive correlation (R>0.63) involving biomass (TDM, SDW and RDW), plant height (PH) and leaf number (LN) parameters when being associated against various physical stomatal properties including SCA, SCL, and SPAL but a negative significant negative correlation was obtained between the growth and leaf parameters against stomatal density (SD, R<-0.04). These vegetative growth measures and stomatal size properties also had some significant (P<0.05) positive correlation with photosynthesis measures including Amax, Jmax and Vcmax (R > 0.60) .

Figure 3.31 : Correlation heat map analysis among the vegetative growth and leaf properties, stomatal traits, and photosynthesis characteristics of the pooled MR219 aCO2 and eCO2 seedlings at 25 DAS. Note: TDM: Total dry weight, SDW: Shoot Dry Weight, RDW: Root Dry Weight, S/R ratio: Shoot Root Ratio, PH: Plant Height, LN: Leaf Number, LL: Leaf 5 Length, LW: Leaf 5 Width, LT: Leaf 5 Thickness, SCA: Stomatal Complex Area, SCL: Stomatal Complex Length, SCW: Stomatal Complex Width, SPA: Stomatal Pore Area, SPAL: Stomatal Pore Aperture Length, SPAW: Stomatal Pore Aperture Width, SD: Stomatal Density, Amax: Maximum net assimilation rate, gsmax: maximum stomatal conductance, iWUEmax: maximum intrinsic water use efficiency, ΦPSIImax: the maximum photochemical quantum yield of PSII, ETRmax: maximum electron transport rate, ΦCO2max, the maximum quantum yield of CO2 assimilation, Jmax: maximum light and CO2 saturated electron transport rate, Vcmax: maximum Rubisco carboxylation rate; A400, net assimilation rate at 400ppm CO2. Values are Pearson correlation coefficients, which are used to construct the heat map. , * or *** represent a significant difference with the parameters of P < 0.05, P<0.01 and P < 0.001, respectively

Figure 3.32 : Correlation heat map analysis among the vegetative growth and leaf properties, stomatal traits, and photosynthesis characteristics of the pooled MR263 aCO2 and eCO2 seedlings at 25 DAS. Note: TDM: Total dry weight, SDW: Shoot Dry Weight, RDW: Root Dry Weight, S/R ration: Shoot Root Ratio, PH: Plant Height, LN: Leaf Number, LL: Leaf 5 Length, LW: Leaf 5 Width, LT: Leaf 5 Thickness, SCA: Stomatal Complex Area, SCL: Stomatal Complex Length, SCW: Stomatal Complex Width, SPA: Stomatal Pore Area, SPAL: Stomatal Pore Aperture Length, SPAW: Stomatal Pore Aperture Width, SD: Stomatal Density, Amax: Maximum net assimilation rate, gsmax: maximum stomatal conductance, iWUEmax: maximum intrinsic water use efficiency, ΦPSIImax: the maximum photochemical quantum yield of PSII, ETRmax: maximum electron transport rate, ΦCO2max, the maximum quantum yield of CO2 assimilation, Jmax: maximum light and CO2 saturated electron transport rate, Vcmax: maximum Rubisco carboxylation rate; A400, net assimilation rate at 400ppm CO2. Values are Pearson correlation coefficients, which are used to construct the heat map. , * or *** represent a significant difference with the parameters of P < 0.05, P<0.01 and P < 0.001, respectively
1.4 Discussion
From the result, targeted treatment with eCO2 has a significant impact on seedling development, stomata properties, and leaf gas exchange in general. The rice seedlings vegetative growth with eCO2 levels increased total dry mass (58% in MR219 and 69% in MR263), shoot dry mass (31% in MR219 and 65% in MR263), plant height (42% in MR219 and 38% in MR263), and leaf number (30% in MR219 and 26% in MR263) of rice seedlings in the experiment as shown in Figure 3.12. The seedlings that were treated with eCO2 differed significantly from the aCO2 seedlings. Similar results were stated by Abzar et al. (2017) for MR269 and MRQ74 seedlings grown in eCO2 conditions inside the glasshouse, where seedling height, shoot, root, and total biomass were significantly higher than the control seedlings. According to Ainsworth & Long (2005), exposure to increasing CO2 levels conditions typically boosted growth and above-ground biomass output; however, the degree of the response varied across crop species, growing seasons, and experimental circumstances. Pritchard et al. (1999) mentioned that elevated CO2 has a major impact on plant development and morphology due to primary and secondary meristem activity in plant shoots and roots. A study done by Jitla et al., (1997) showed the acceleration of shoot elongation and larger shoot apex development of rice seedlings grown in eCO2 conditions. The study also discovered that eCO2 increases the length of leaf primordia and the number of tiller buds. Based on findings by Masle (2000) in the study on wheat stated that eCO2 influenced and stimulate the alteration of plant cell division, growth, and patterning. The findings are also supported by Thilakarathne et al. (2015), which proposed that the availability of a high carbon supply in the environment has been examined as a factor in rapid cell division and expansion of meristematic tissues, as well as improved plant initial growth and productivity. These findings also show that eCO2 treatment enhances the early vigour of rice seedlings which according to Shi et al. (2020), is one of the traits required for high-yielding crops where the seedlings can develop rapidly, faster crop canopy establishment and increase competitiveness.
The results show that eCO2-grown rice leaves have greater leaf length (32% increase for MR219 and 8% increase for MR263) and leaf width (11% increase for MR219 and 2% increase for MR263), as well as thicker leaf blades (33-38% increase for MR219 and 22-33% increase for MR263) than aCO2 grown rice leaves. Environmental factors, such as eCO2, have an impact on morphological traits and the anatomy of the rice leaf as reported by Tsutsumi et al. (2014). Works done by Tsutsumi et al.(2014) demonstrated that the rice leaf blade thickness was increased by eCO2 which aided the growth of bundle sheath extensions at the ridges of vascular bundles. Thinh et al. (2018) revealed that eCO2 increased the internal leaf tissues (thickness layer of palisade cells) in yam (Dioscorea spp.) while Prior et al. (2004) mentioned that the eCO2 leaf had an extra layer of palisade cells and greater leaf expansion due to increased cell wall relaxation and/or cell turgor. The eCO2 also enhances cell length, size, area and perimeter of the palisade mesophyll layer and spongy tissues in soybean (Glycine max) leaf at 600 ppm eCO2 level as reported by Zheng et al.(2019). The palisade mesophyll layer is where most of the photosynthesis occurs in the leaf and contains a lot of chloroplasts (Yahia et al., 2019). Increases in mesophyll and vascular tissue area are thought to be crucial factors in the plant's photosynthetic capacity and assimilate transport efficiency. Plants that are exposed to eCO2 have a greater rate of leaf establishment and growth, as well as a greater leaf area according to Seneweera et al.(1995) and Taylor et al. (2001).
Stomata are microscopic gas exchange portals between the leaf mesophyll cells and the surrounding environment. Stomata control leaf gas exchange by allowing CO2 uptake from the atmosphere to diffuse into the chloroplast for the photosynthesis process while also limiting excessive water loss through transpiration. According to Haworth et al. (2021), the flux of CO2 and H2O through the surface of the leaf is occurred simultaneously influenced by the epidermal and stomatal characteristics such as the stomata quantity, size, the dimension of the stomatal aperture, and the control of stomatal pore aperture in response to external environmental conditions. The data reported here show that various stomatal properties parameters are, in general, larger stomatal complex area (SCA) and stomatal pore area (SPA) for eCO2-grown leaves than ambient-grown leaves. In this study chapter, as shown in Figure 3.17, the data show the dimension area of the stomatal complex of MR219 increased by 14% and MR263 by 45.7%. The area of the stomatal pore aperture of MR219 also showed an increase of 62% and the SPA of MR263 increased by 64.4%. The findings of the study also found that eCO2 also directly enhances the length and width of the stomatal complex and pore (Figure 3.17).
Increased CO2 concentrations influenced not only individual stoma morphology but also stomatal distribution on rice leaves. The stomatal density in the rice leaf blade was 10.8% (MR219) and 19.2% (MR263) reduced in eCO2 than in aCO2. Uprety et al. (2002), found an increase in stomatal size in terms of guard cell length, width and also the stomatal pore at both adaxial and abaxial leaf surfaces in four rice varieties (Pusa-Basmathi-1, P-677, P-834 and P-2503-6-693) under eCO2 treatment. In the study, an increase in stomatal size with eCO2 treatment was recorded showing 10.5% for Pusa-Basmathi-1, 81.29% for P-677 variety, 35.68% for P-834 and 38.75% for P-2503-6-693 variety. The study also found a significant reduction at 6-18% in stomata density for the four varieties mentioned. This observation on stomatal size and density is also supported by Driscoll et al. (2006) who found the size of the stomata and stomatal index were increased but the stomatal density was reduced in both the adaxial and abaxial surface of the maize leaves. The findings also point out that CO2 is engaged in signal transduction mechanisms that alter leaf anatomical structure and activity, as well as being the main substrate in gas absorption activities. It is stated by Lake et al. (2001, 2002) that mature leaves on plants can transmit long-distance signals of information to the developing leaves about the environment's CO2 concentrations and in turn regulate the stomata formation, number, and function. The incidence of SD decreasing in eCO2 may be associated with the promotion of leaf area (Xu et al., 2014). In addition, there are also reports summarised by Xu et al. (2016) on relevant genes associated with stomatal formation and development that responds to the eCO2 environment such as HIC, EP3, EPF2, STOMAGEN, and others.
Overall, eCO2 treatment improved gas exchange efficiency and photosynthetic performance compared to ambient for both rice varieties. However, the findings also discovered that MR219 (older variety) leaves have higher positive changes across various physiological parameters compared to MR263 as shown in Figure 3.30. When light is non-limiting, the eCO2 leaves of MR219 achieve higher water use efficiency (68% higher iWUEmax than aCO2 while MR263, 38% higher iWUEmax than aCO2 as shown in Fig 3.30 and iWUE in Figure 3.21) resulting from exceptionally high assimilation (34% higher Amax than aCO2 while MR263, 16% higher Amax than aCO2 as shown in Fig 3.30 and A in Figure 3.18) coupled with the notable reduced amount of transpiration (-38% lower gsmax than aCO2 as shown in Fig 3.30 and gs in Figure 3.20). This signals for eCO2 seedlings to possess special ability in terms of minimum water requirements while still maintaining seedling’s growth vigour that remain uncompromised. Findings from this study are supported by a meta-analysis of FACE experiments for 20 years on rice published by Hu et al. (2022) showed an increase in saturated assimilation rate (18.1%-27.9%) and WUE (27.4%-46%) while gs decreased by 13-23.8% for the three types of rice groups (indica, japonica and hybrid rice). In other reports, the eCO2-enhances saturated assimilation rate by 15-35% in C3 crops and grass however eCO2 induced gs decreased by 22% across all plant species and 30-40% for C3 grass based on FACE trials meta-analysis (Ainsworth & Rogers, 2007).
This efficient water use by eCO2 of MR219 could be primarily attributed to biochemical enhancement rather than due to stomatal properties since the changes in this regard are minimum. Various biochemical components contribute to the overall process leading to notable water use efficiency due to remarkably high carbon assimilation. It starts at the photoreactions level within the thylakoid vicinity of the chloroplasts by having a productive PSII that sequentially results in rapid electron transfer thus creating an abundance of high-energy phosphorylating molecules (ATPS) and electron donors (NADPH) to be used by the next reaction in the stroma of the chloroplast. Evidence can be seen in Figs 3.22, 3.23, and 3.30, where eCO2 shows an increase in ΦPSII by 29% and ETR by 16-31%. The boosted state of photosystem health and its products has in turn resulted in a rapid turnover of the light-independent reactions (Calvin Cycle) that utilize the aforementioned products from the photoreactions. The improved CO2 fixation efficiency per absorbed photon culminates in the high production of photosynthates (G3P) which translates into massive biomass accumulation. This is shown by the increase of ΦCO2 (56% in MR219 and 42% in MR263) and Vcmax (37% in MR219 and 33% in MR263) by eCO2 treatment as shown in Figure 3.30. The rapid cycle turnover is also the result of high electron transport rates (Jmax) creating more ATPs, thus satisfying the need for RUBP regeneration in the cycle for further carbon fixation and reduction events. The findings clearly show that the Jmax of eCO2 increased by 21% (MR219) and 29% (MR263) compared to aCO2 (Figure 3.29 and 3.30). Vcmax (the highest rate of RuBP carboxylation) and Jmax (maximum rate of electron transport in light-dependent processes) are biochemical capabilities of the photosynthetic system that are important in determining the carbon assimilation process (Quebbeman & Ramirez, 2016). In an experiment on cucumber (Cucumis sativus L.), Liu et al., (2018) found that eCO2 increased assimilation rate, Vcmax, and Jmax, indicating that eCO2 can promote assimilation by boosting electron transport and photophosphorylation activities. Experiments on diverse C3 plant species with the FACE method also revealed that eCO2 increased leaf photosynthesis properties and photosynthetic carbon gain (Leakey et al., 2009). Long-term introduction to eCO2 can stimulate photosynthetic down-regulation, resulting in a decline in Vcmax according to Hu et al., (2022), but we believe the differences were due to our short-term (25-day) exposure to eCO2 conditions and the seedlings' lack of acclimation to it.
The CO2/O2 ratio will increase as the CO2 concentration at the CO2 fixation site rises; hence, Rubisco's carboxylation efficiency will be improved by reducing the rate of photorespiration (Bowes, 1991). The ratio of ΦPSII from fluorescence to ΦCO2 from the gas exchange is used in the study to determine how efficiently the rice seedlings utilize absorbed light energy to assimilate CO2 can be applied as an indicator of photorespiration level (Singh & Reddy, 2018). The eCO2 seedlings are relatively efficient in converting light energy to chemical energy. This is based on the lower ΦPSII/ ΦCO2 ratio of eCO2 when compared to the ambient as shown in Fig 3.25 which implies that when photorespiration is reduced, fewer quanta are required per CO2 molecule assimilated (Singh & Reddy, 2015). Data indicates that eCO2 increases photosynthesis by increasing total linear electron transport and improving ATP and NADPH utilization. Furthermore, rice seedlings growing at eCO2 conditions have a larger ability for RuBP regeneration as well as a higher quantity of potential Rubisco activity, as seen by increased carboxylation efficiency. Furthermore, eCO2 plants have better photochemical efficiency and reduced photorespiration levels. According to Gamage et al. (2018), the photochemical efficiency of photosystems increases under eCO2 due to an increase in the expression of genes and proteins associated with the light response of photosynthesis.
1.5 Conclusion
The findings presented here indicate that local Malaysian rice seedling varieties can exhibit a significant positive response to elevated CO2 levels. In the study, we found that the growth parameters (seedling height, leaves number, dry weight of shoot, root and total biomass), leaf properties (thickness of leaves and length), stomatal properties (stomatal complex, stomatal pore aperture) and the photosynthetic performance such as assimilation rate (A), the quantum yield of photosystem II (ФPSII), electron transport rate (ETR), the quantum yield of CO2 assimilation (ФCO2), ФPSII/ФCO2 ratio, maximum Rubisco carboxylation rate (Vcmax) and the maximum light and CO2 saturated electron transport rate (Jmax) in both rice varieties were significantly greater under eCO2 than under aCO2. The eCO2 treatment also improved the water use efficiency by reducing the stomatal density and stomatal conductance (water loss) of the rice plants. A possible mechanism to explain why the rice seedlings positively respond to eCO2 is that eCO2 increases the thickness of the leaf blade which may add an extra layer of the palisade cell, number of leaves and leaf area; and positively supports the photosynthesis apparatus such as chloroplasts and stomata anatomy in the rice seedlings. Thus, the photosynthetic performance in the rice seedlings was enhanced under eCO2 than that in aCO2 rice plants. Because of the increase in the photosynthetic performance, the seedling growth increased under eCO2. The results indicated that eCO2 is a positive resource for growth in rice seedlings from an early growth stage which also promotes an early vigour for the crops which is a desirable trait for high-yielding crops.


Comments