

Practical Plant Growth Analysis Galangal Plastochron
- Scense Me
- Apr 20
- 4 min read

1. Introduction
Growth analysis is a mathematical expression of environmental effects on the growth and development of crop plants. Classical growth analysis typically requires the destructive harvesting of representative sets of plants over several weeks, making it impossible to follow the same plant throughout an entire experiment.
This practical introduces a non-destructive, single-harvest alternative by utilizing a space-for-time substitution. By examining a single frond of galangal (Alpinia galanga), we can observe leaves at different developmental stages on the same plant. Because leaves emerge sequentially from the shoot apex at regular time intervals (the plastochron), the spatial position of a leaf along the stem directly correlates with its chronological age. The topmost leaf is the youngest, and the lowest leaf is the oldest.
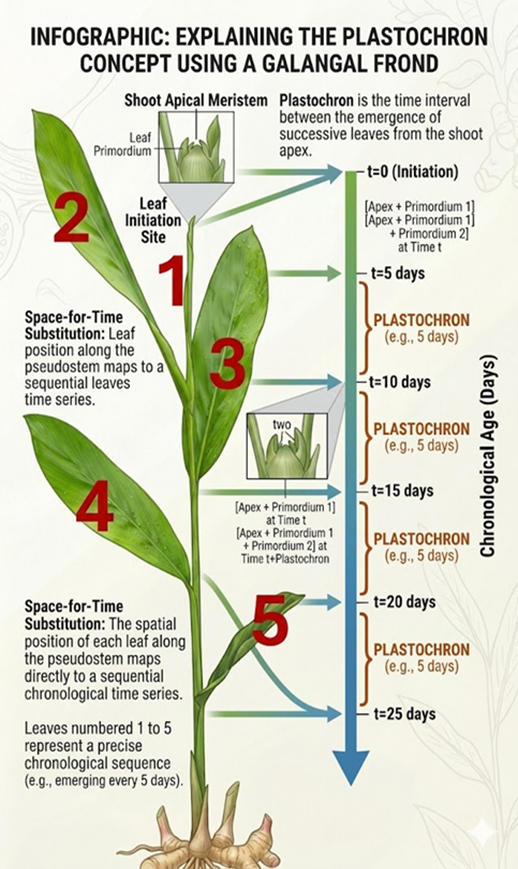
2. Theory
Plant growth is a quantitative, irreversible increase in size, mass, or cell number. The typical growth pattern of a plant follows a sigmoid curve, divided into three main phases:
i. Lag phase: Initial stage where the growth rate is quite slow.
ii. Log or exponential phase: Growth rate is at its maximum due to rapid cell division and physiological processes.
iii. Stationary/Senescence phase: Growth is almost complete and becomes static, with the growth rate approaching zero.

Using the differences in leaf area and leaf dry weight between adjacent leaves on the stem, we can calculate four fundamental growth indices.
Formula Variable Legend (READ CAREFULLY)
Because we are comparing leaves chronologically down the stem, 1 always refers to the younger, upper leaf, and 2 refers to the older, lower leaf.
• W1 = Dry weight of the younger leaf in grams (g)
• W2 = Dry weight of the older leaf in grams (g)
• T1 = Assumed age of the younger leaf in days (day)
• T2 = Assumed age of the older leaf in days (day) (Note: The time interval T2 - T1 will always be 5 days for this practical).
• A1 = Leaf area of the younger leaf in square centimetres (cm²)
• A2 = Leaf area of the older leaf in square centimetres (cm²)
• A = Specific Ground Area. For this practical, assume each galangal shoot occupies a ground area of 0.01 m² (which is 100 cm²).
• ln = Natural Logarithm (loge). Use the "ln" button on your scientific calculator.
The Growth Formulas
• Absolute Growth Rate (AGR): The rate of increase in dry matter, indicating the total growth of the plants. AGR = (W2 - W1) / (T2 - T1) [Unit: g/day]
• Relative Growth Rate (RGR): The rate of increase in dry matter per unit of existing dry matter, indicating the proportionate growth of the plant independent of its size. RGR = (ln W2 - ln W1) / (T2 - T1) [Unit: g/g/day]
• Crop Growth Rate (CGR): The rate of increase in dry matter per unit ground area, indicating the dry matter production capacity per unit area. CGR = (W2 - W1) / [A (T2 - T1)] [Unit: g/m²/day]
• Net Assimilation Rate (NAR): The rate of increase in dry matter per unit leaf area, indicating the assimilatory capacity of the plant. NAR = [(W2 - W1) / (T2 - T1)] [(ln A2 - ln A1) / (A2 - A1)] [Unit: g/cm²/day]
3. Objectives
i. To identify spatial and temporal integration of plant processes using a constant plastochron interval.
ii. To calculate AGR, RGR, CGR, and NAR using primary values (dry weights).
iii. To construct a sigmoid growth curve to know how the rate of dry matter accumulation varies across the life cycle.
4. Materials
• 1 Galangal frond per group (standardised to exactly 5 intact leaves)
• Leaf area meter (or digital scanner)
• Scissors / secateurs
• Paper envelopes or bags
• Analytical balance
• Drying oven (set to 50°C)
5. Methodology
Day 1: Fresh Measurements
i. Obtain one galangal frond with exactly 5 healthy leaves.
ii. Label your paper bags 1 through 5.
iii. Designate the topmost (youngest) leaf as Leaf 1 and the lowest (oldest) leaf as Leaf 5.
iv. Carefully excise each leaf at the collar.
v. Determine the Leaf Area (A) for each of the 5 leaves using the provided leaf area meter. Record this in Table 1.
vi. Place each leaf into its corresponding labeled paper bag.
vii. Place all bags into the drying oven set at 50°C. Leave them to dry for exactly one week.
Day 7: Dry Weight Measurements & Calculations
i. Remove the paper bags from the oven.
ii. Using the analytical balance, weigh each leaf to determine its Dry Weight (W). Record this in Table 1.
iii. Complete the data calculations in Table 2 using the formulas provided in the Theory section.
6. Data Tables
Table 1: Raw Morphological Data (Assume a constant plastochron interval of 5 days.)
Leaf Position | Assumed Age (T) | Leaf Area, A (cm²) | Dry Weight, W (g) |
1 (Top / Youngest) | 5 days |
|
|
2 | 10 days |
|
|
3 | 15 days |
|
|
4 | 20 days |
|
|
5 (Bottom / Oldest) | 25 days |
|
|
Table 2: Growth Parameter Calculations (Ground Area A = 0.01 m²)
Growth Interval | Time Interval | AGR (g/day) | RGR (g/g/day) | CGR (g/m²/day) | NAR (g/cm²/day) |
Leaf 1 to 2 | 5 days |
|
|
|
|
Leaf 2 to 3 | 5 days |
|
|
|
|
Leaf 3 to 4 | 5 days |
|
|
|
|
Leaf 4 to 5 | 5 days |
|
|
|
|
7. Expected Results & Discussion Points
1. The Sigmoid Curve: Plot the Assumed Age (x-axis) against Dry Weight (y-axis). You should observe a classic S-shaped curve, identifying the lag phase, the log/exponential phase, and the stationary phase.
2. AGR & CGR Dynamics: AGR and CGR are expected to peak during the log phase, where the plant experiences the maximum rate of dry matter accumulation, and decline as the leaf enters the senescence period.
3. RGR Dynamics: RGR is dynamic, typically starting high and then declining over the life cycle as plants grow and self-shade. It is highest in the younger tissues (Leaf 1 to 2) and declines over time, reflecting a drop in the plant's proportional growth as it increases in size.
4. NAR Dynamics: NAR typically decreases in the older leaves. This reflects a drop in assimilatory capacity, often due to self-shading and senescence in the lower canopy.
Manual PDF can be downloaded here:


Comments